Registration will always be free and takes about two minutes. As a registered user of the Global Fishing Watch map, you will have full access to all the map features, allowing you to:
- View heatmaps of fishing and vessel activity
- Identify vessels and routes
- Download fishing activity reports
- Review detailed events along vessel routes, including fishing activity and potential encounters
- Create an analysis of specific areas
- Save and manage workspaces
- Review fishing effort by flag, date range or gear type
- Search for vessels
- Combine fishing effort layers from various data sources
- Search activity by date range and create animations of vessel activity
- Overlay jurisdictional boundaries and other reference layers
- Measure distances between activities
- Create your own visualizations by sharing workspaces and screenshots
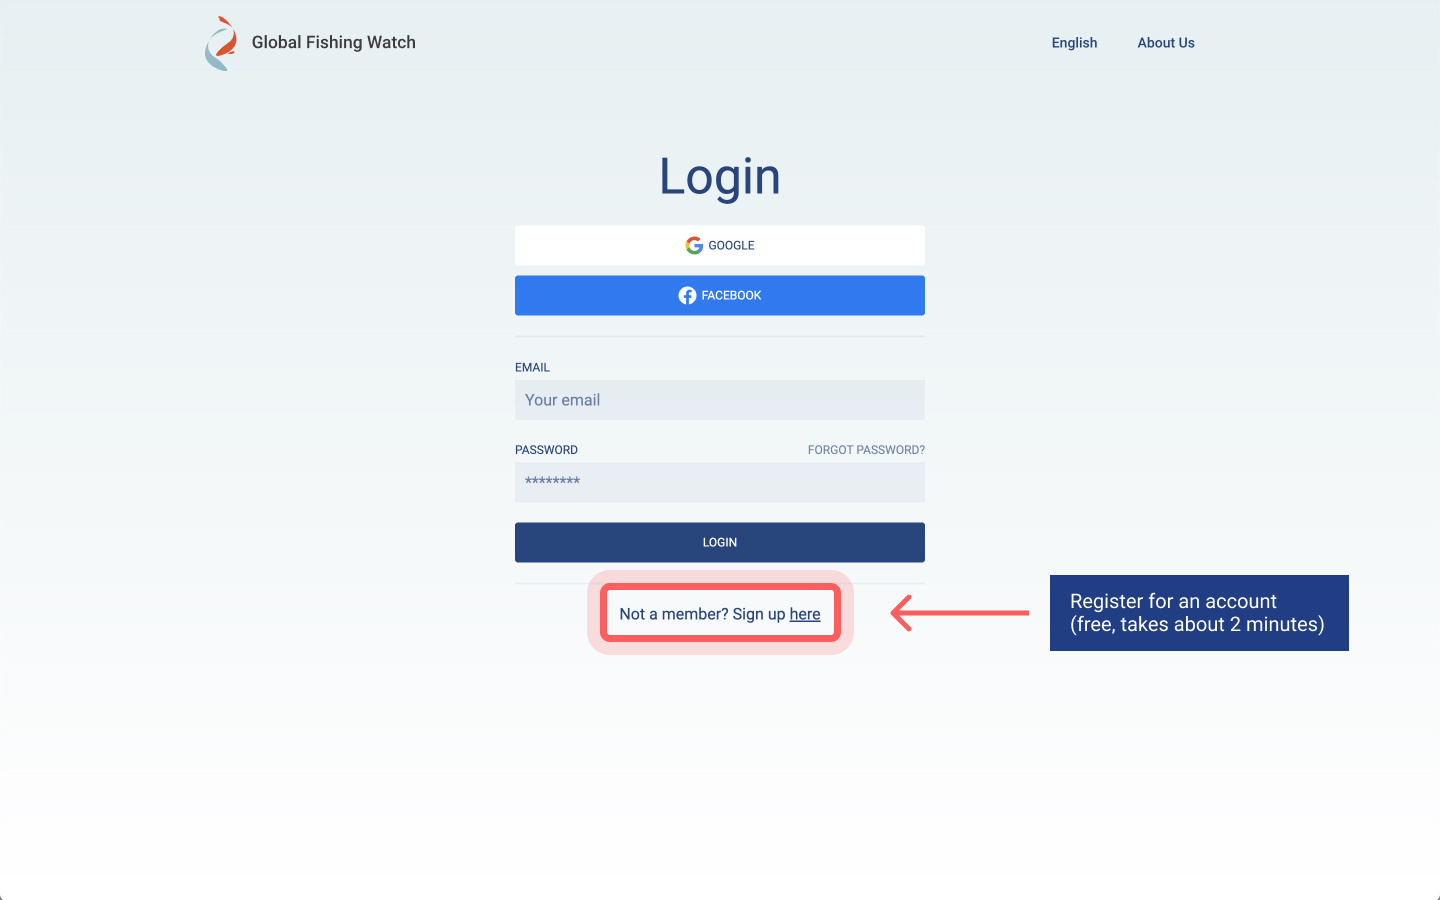
Visit the registration page to sign up for a Global Fishing Watch account. You can use your Google or Facebook account to register, or create an account and password using your email address by clicking on “Not a member? Sign up here.”
For more information on how to register, see our FAQs.
You can check if you are logged in to your account by looking at the bottom left corner of the map. If you are logged in, you will see your initials.
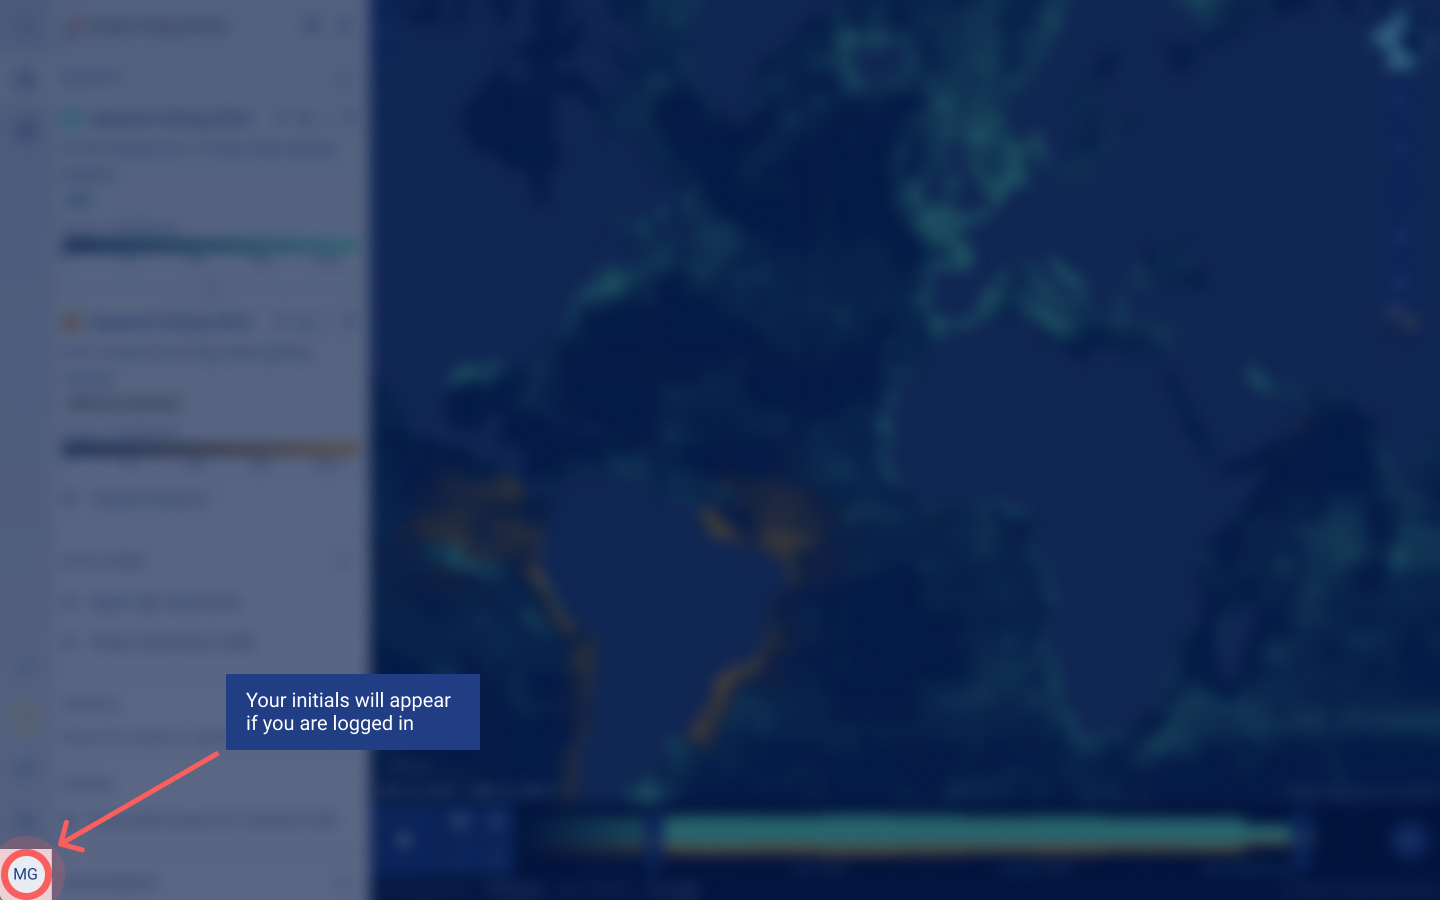
If you are not logged in you will see the profile icon. Click on the icon to log in or register for an account.
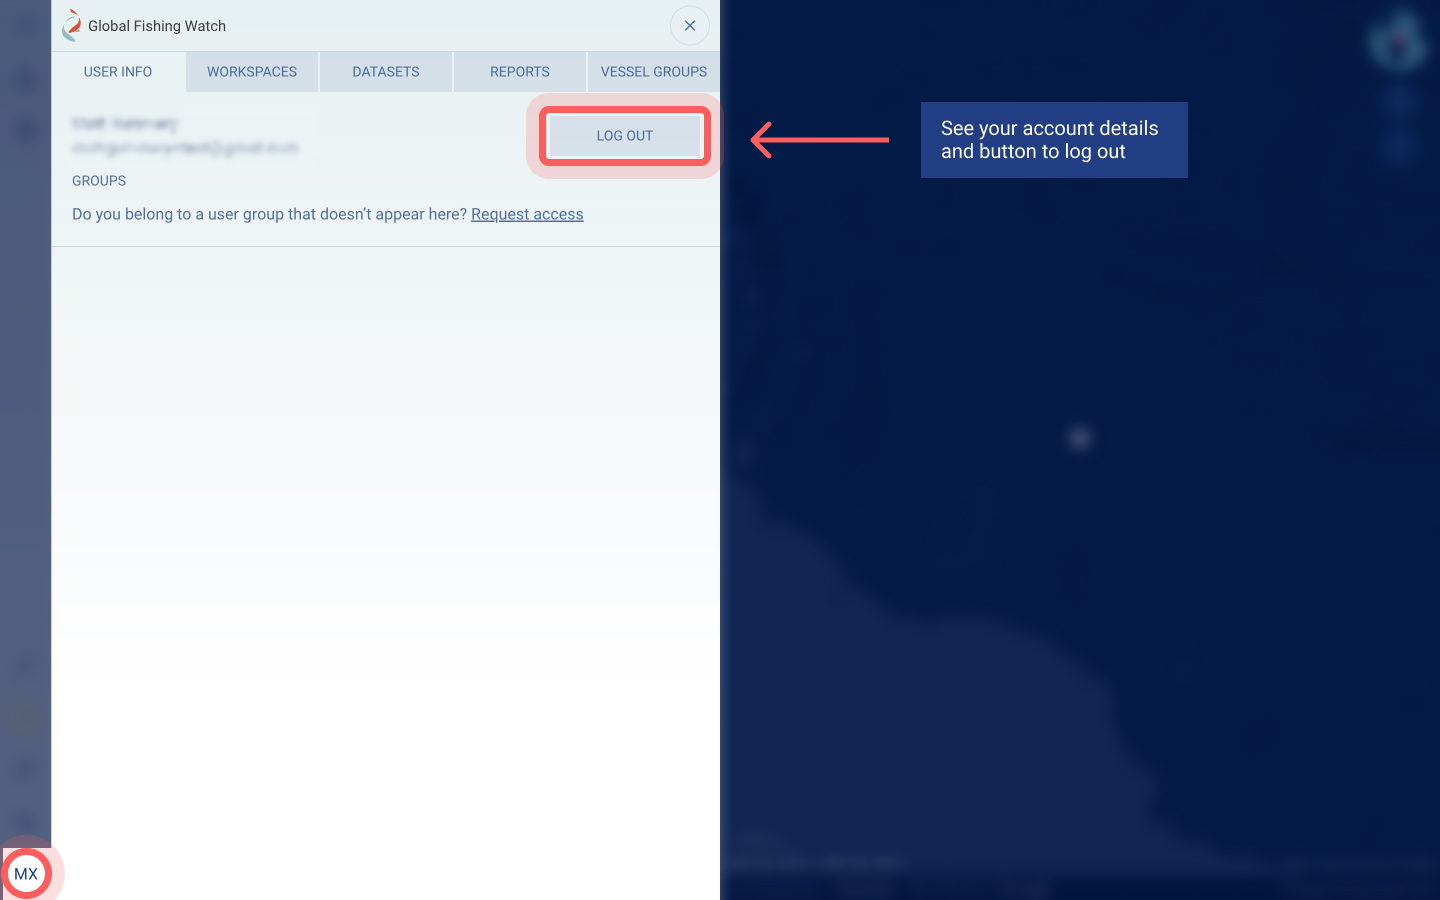
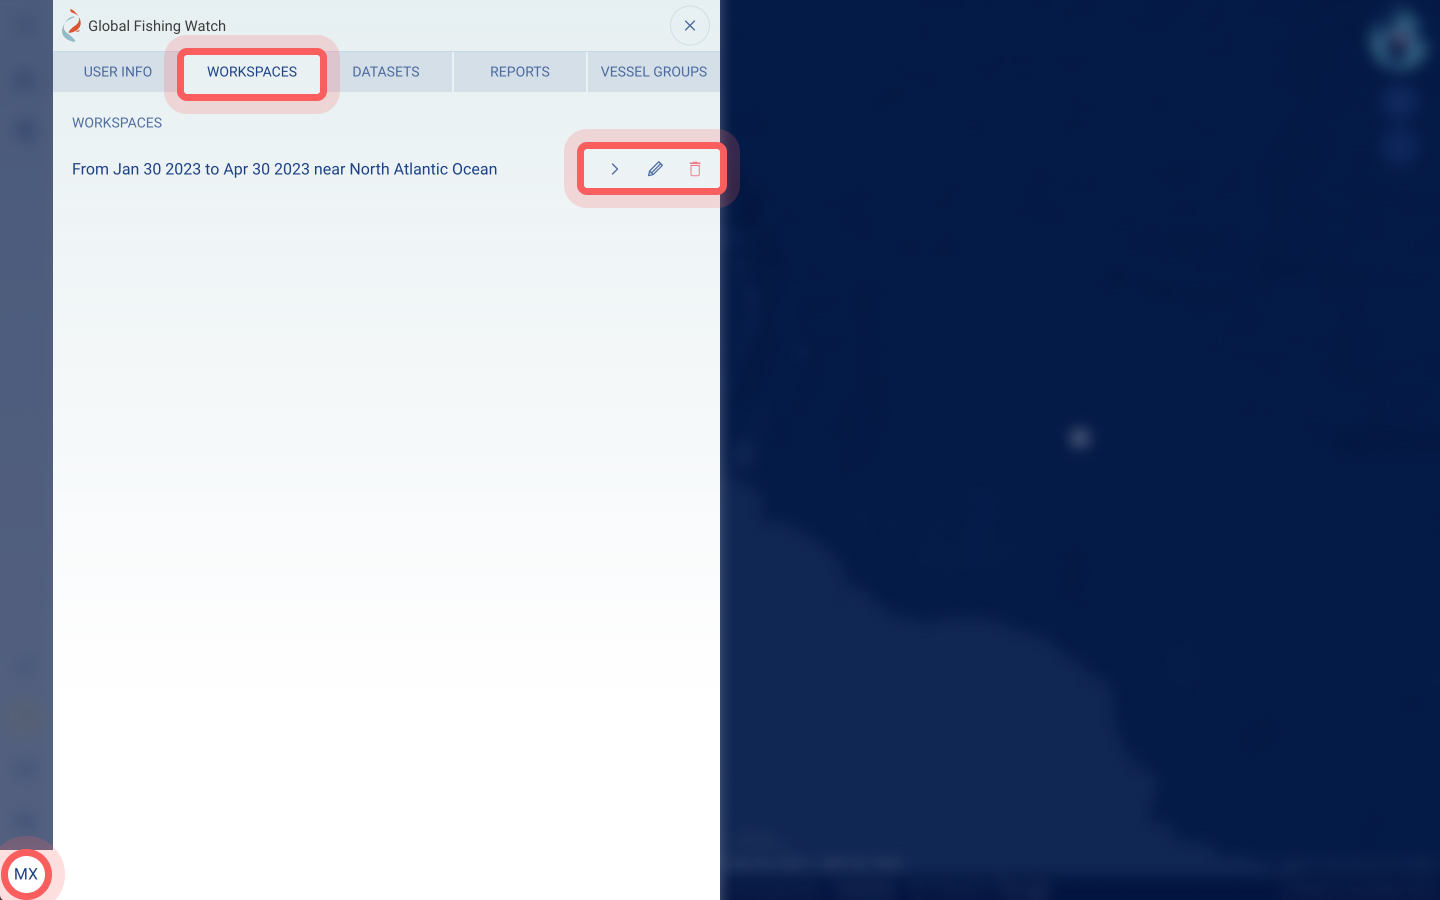
When you register for a Global Fishing Watch account, you will be able to access your profile at any time by clicking on your initials located in the bottom left-hand corner of the left sidebar. Clicking on your profile will show your registered email address and provide access to your saved workspaces and uploaded data. To log out of your profile, you can click on the “Log out” button at the top of your profile.
To access a saved workspace, click the arrow icon to the right of the workspace name. You can also edit or delete your saved workspaces from your profile.
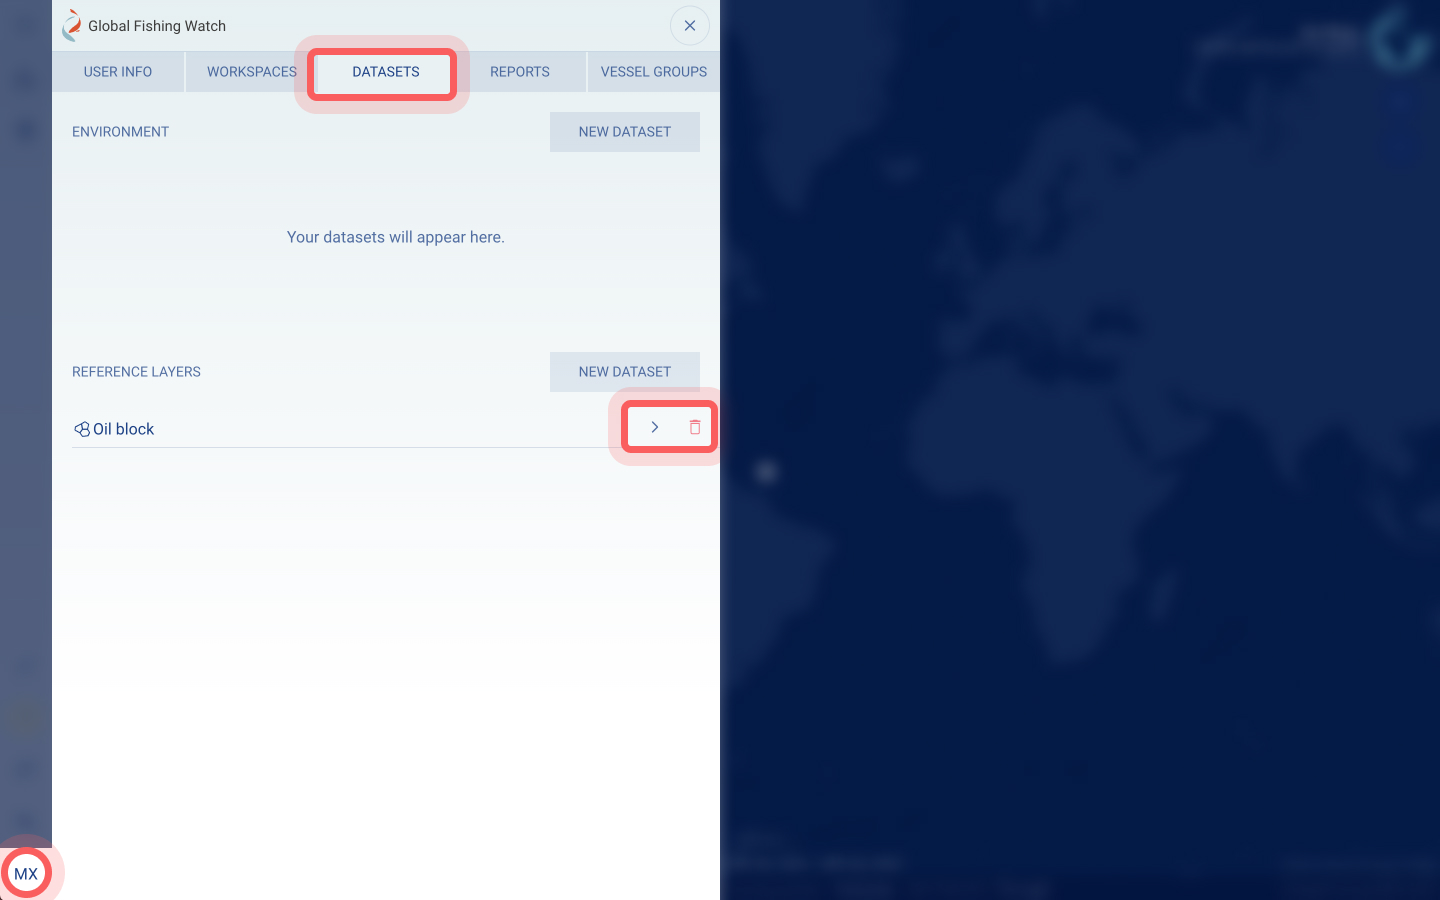
To add your uploaded data from your profile to the map, click on the arrow icon to the right of each dataset that you’d like to add. You can also edit or delete your uploaded data from your profile.
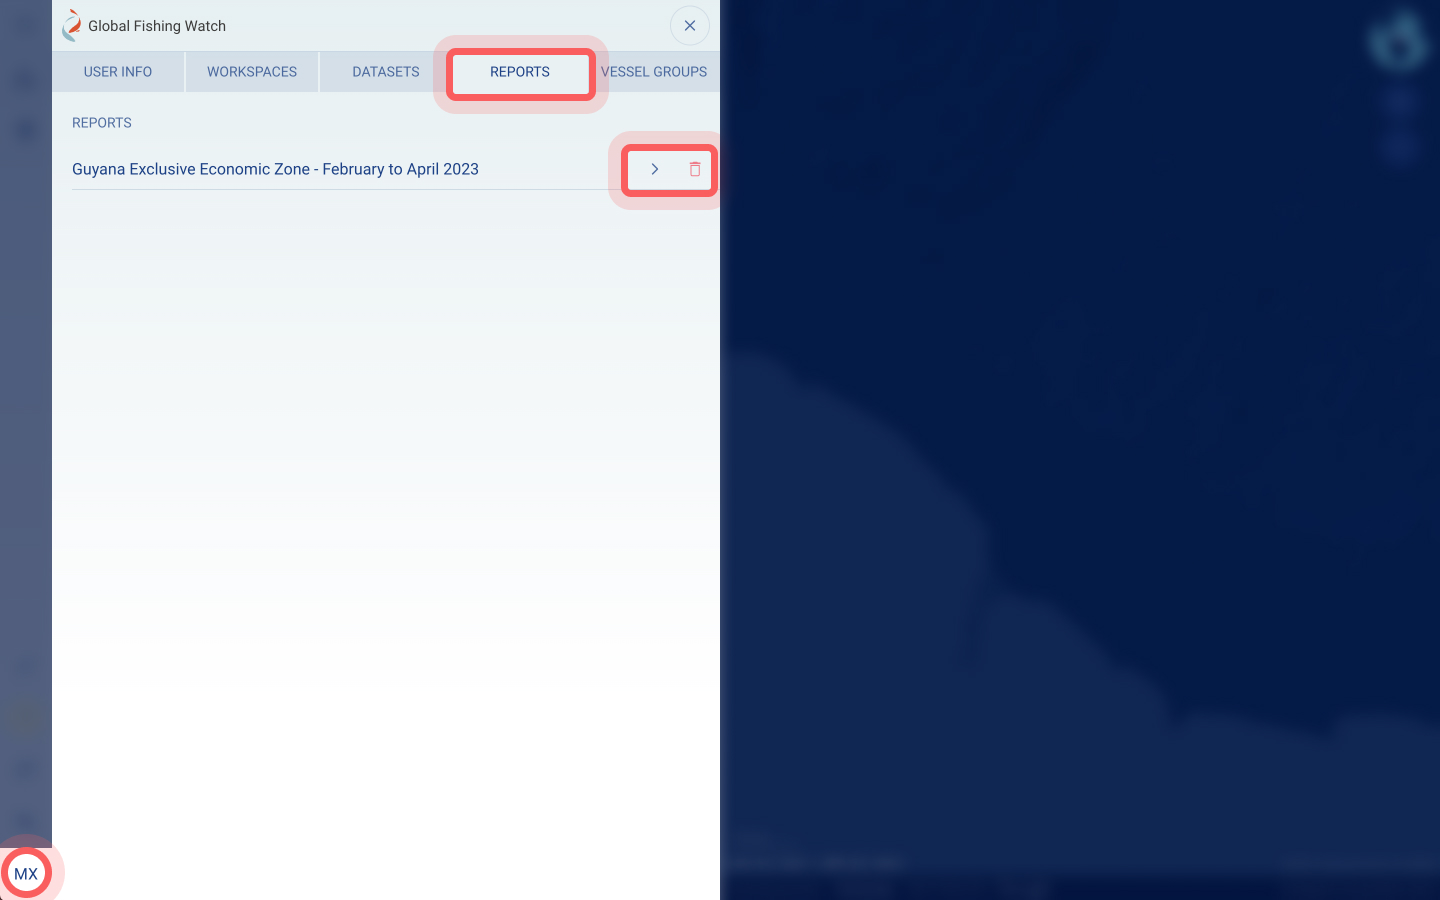
To access a saved report, click on the arrow icon to the right of the report name. You can also edit or delete your saved reports from your profile.
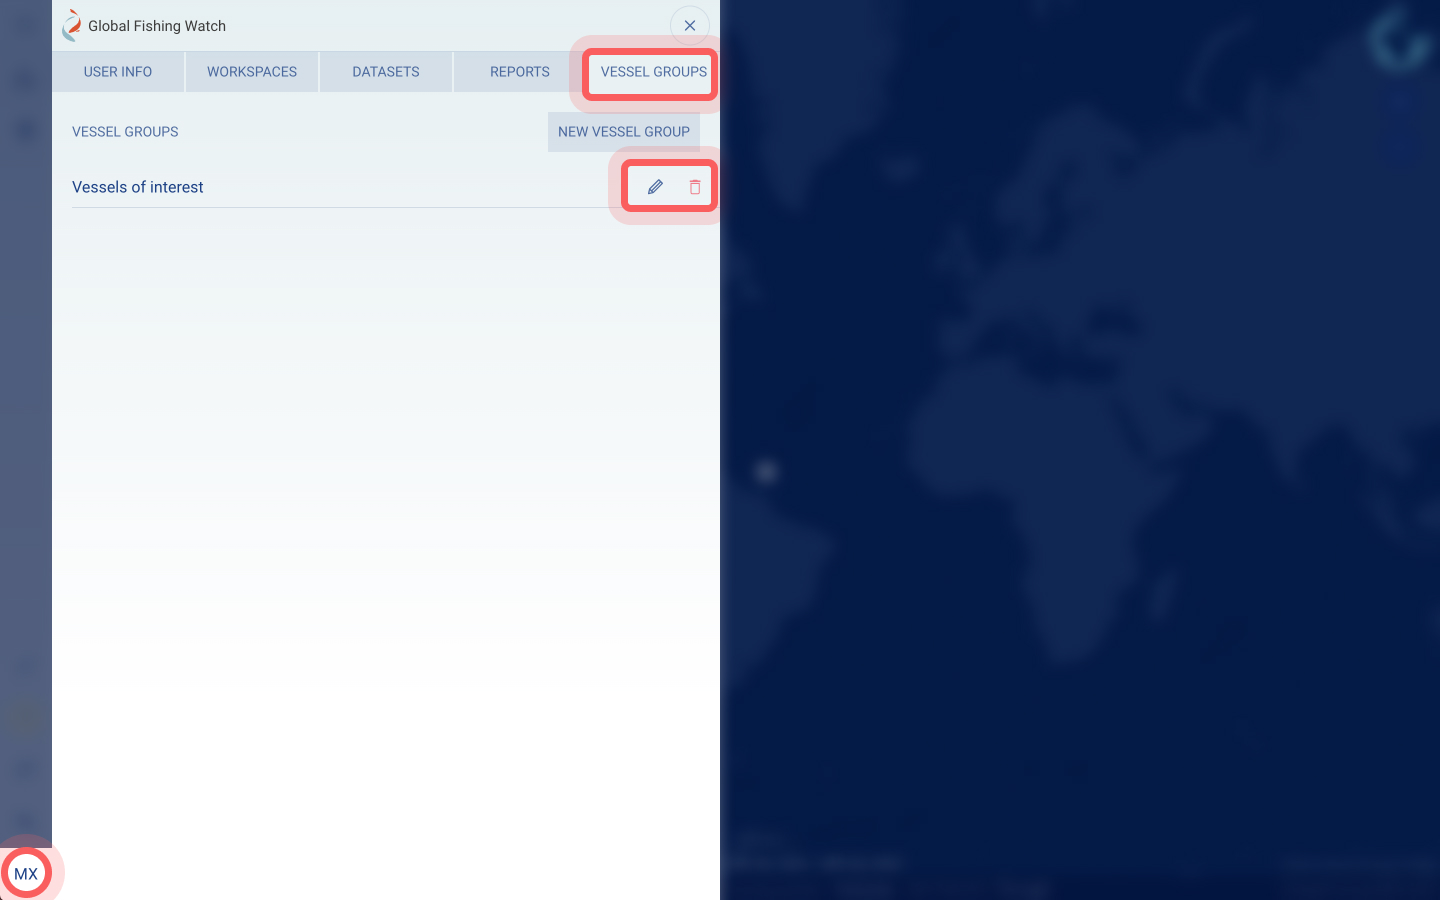
You can edit or delete your vessel groups by clicking on the icons to the right of each dataset.
To learn more about using Global Fishing Watch products:
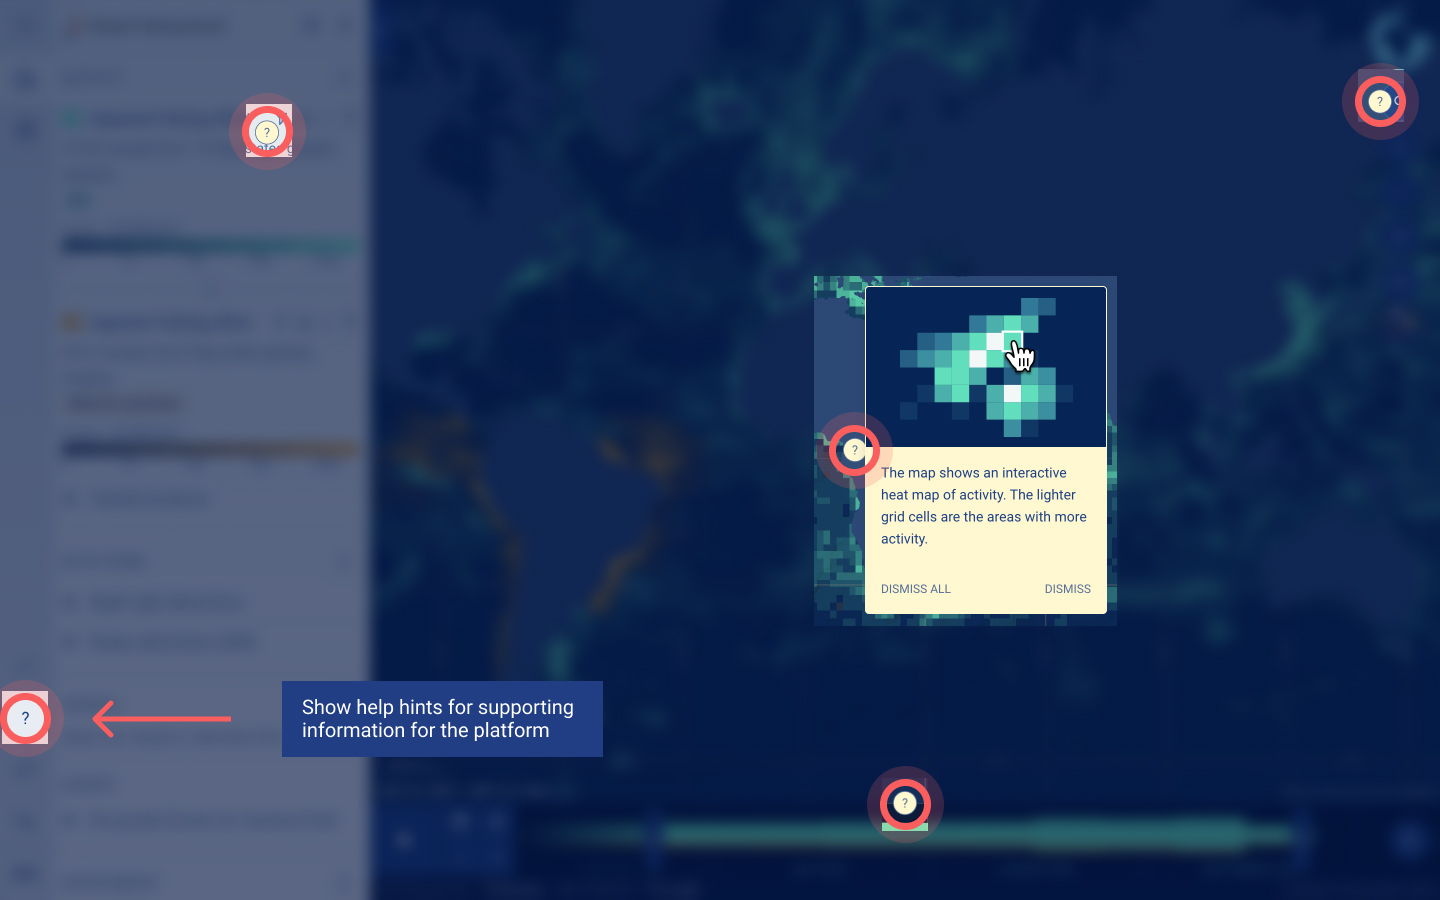
- Access the help hints available throughout the map
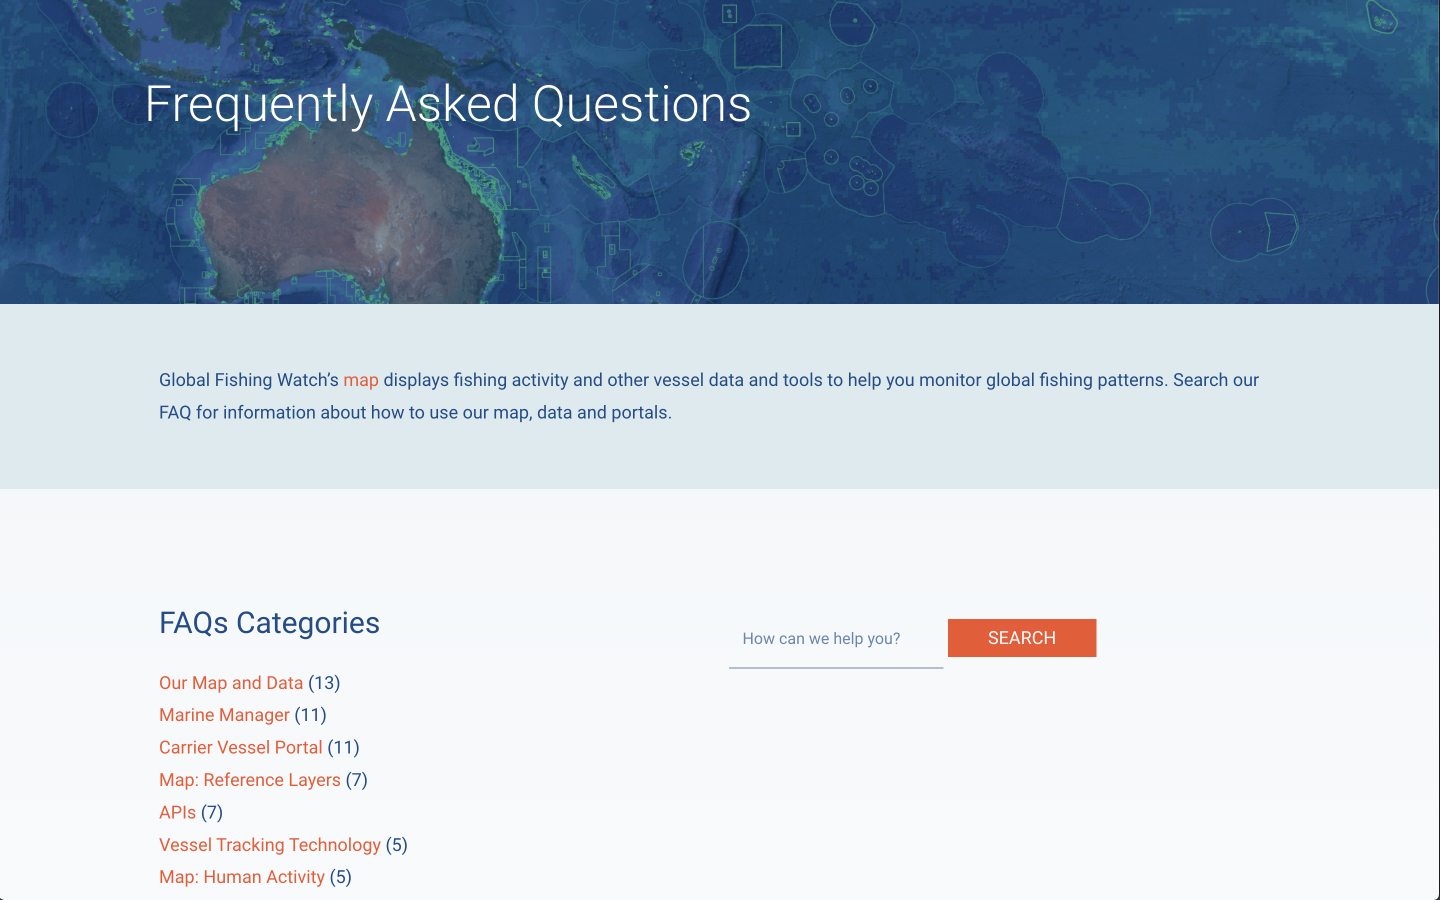
- Review the Global Fishing Watch FAQs
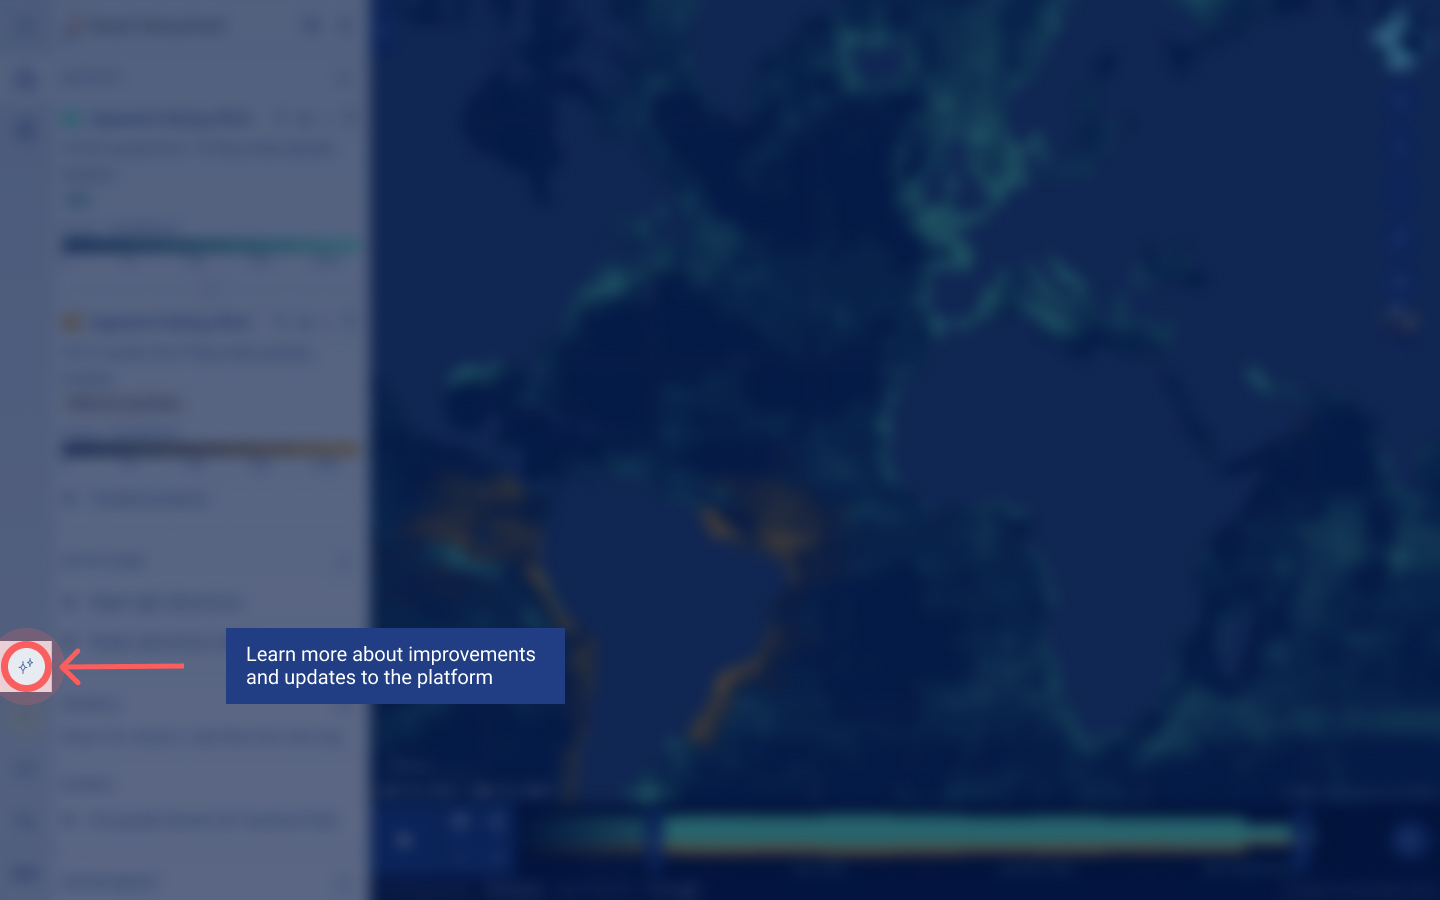
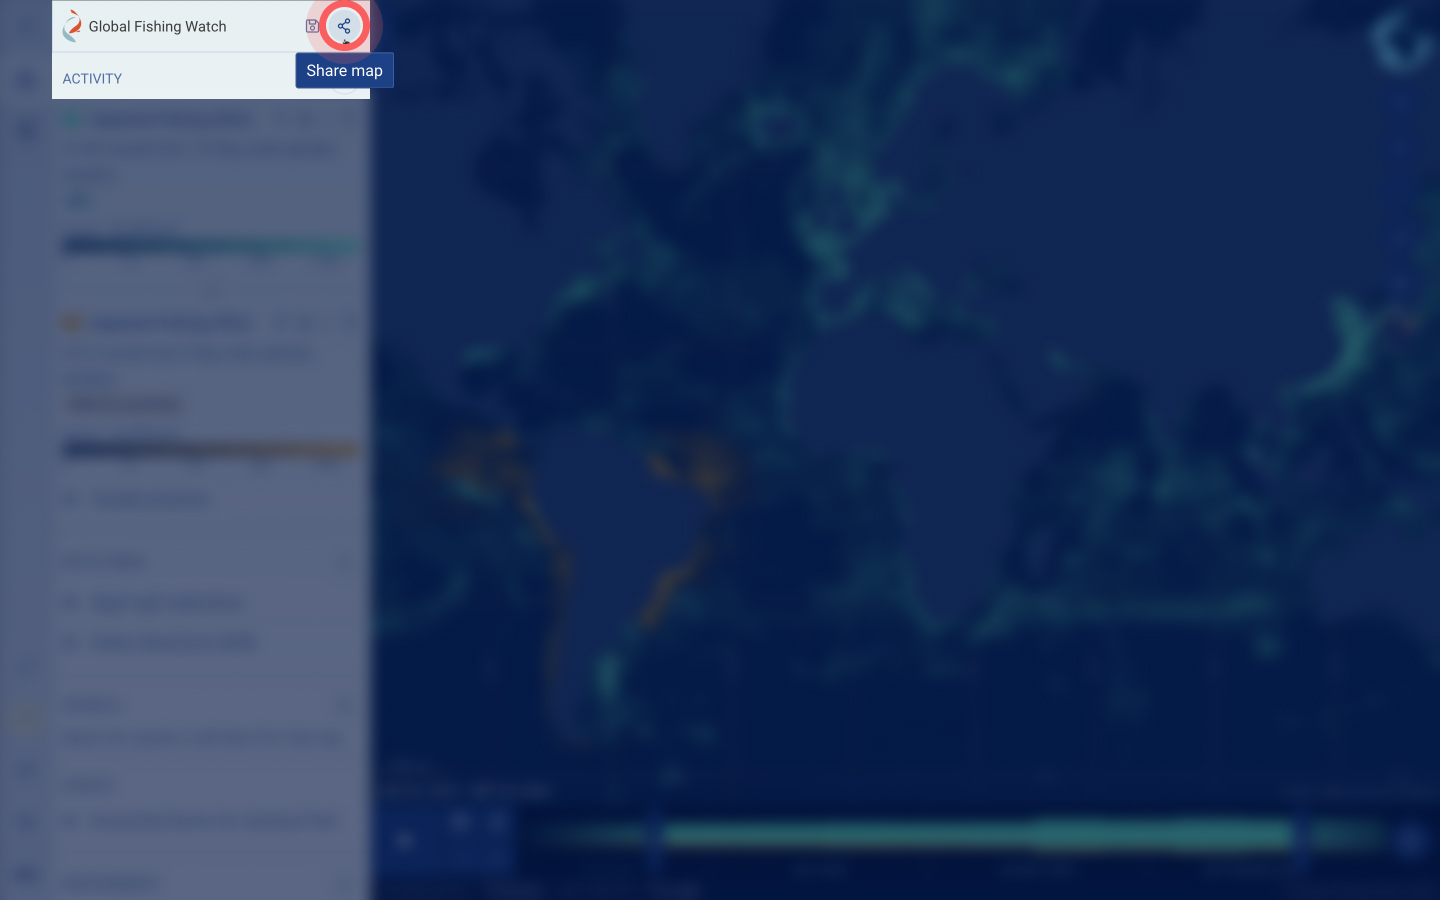
- Visit our platform updates page to see new features within the Global Fishing Watch map. If you are in the map, you can also access the same webpage from the icon highlighted below.
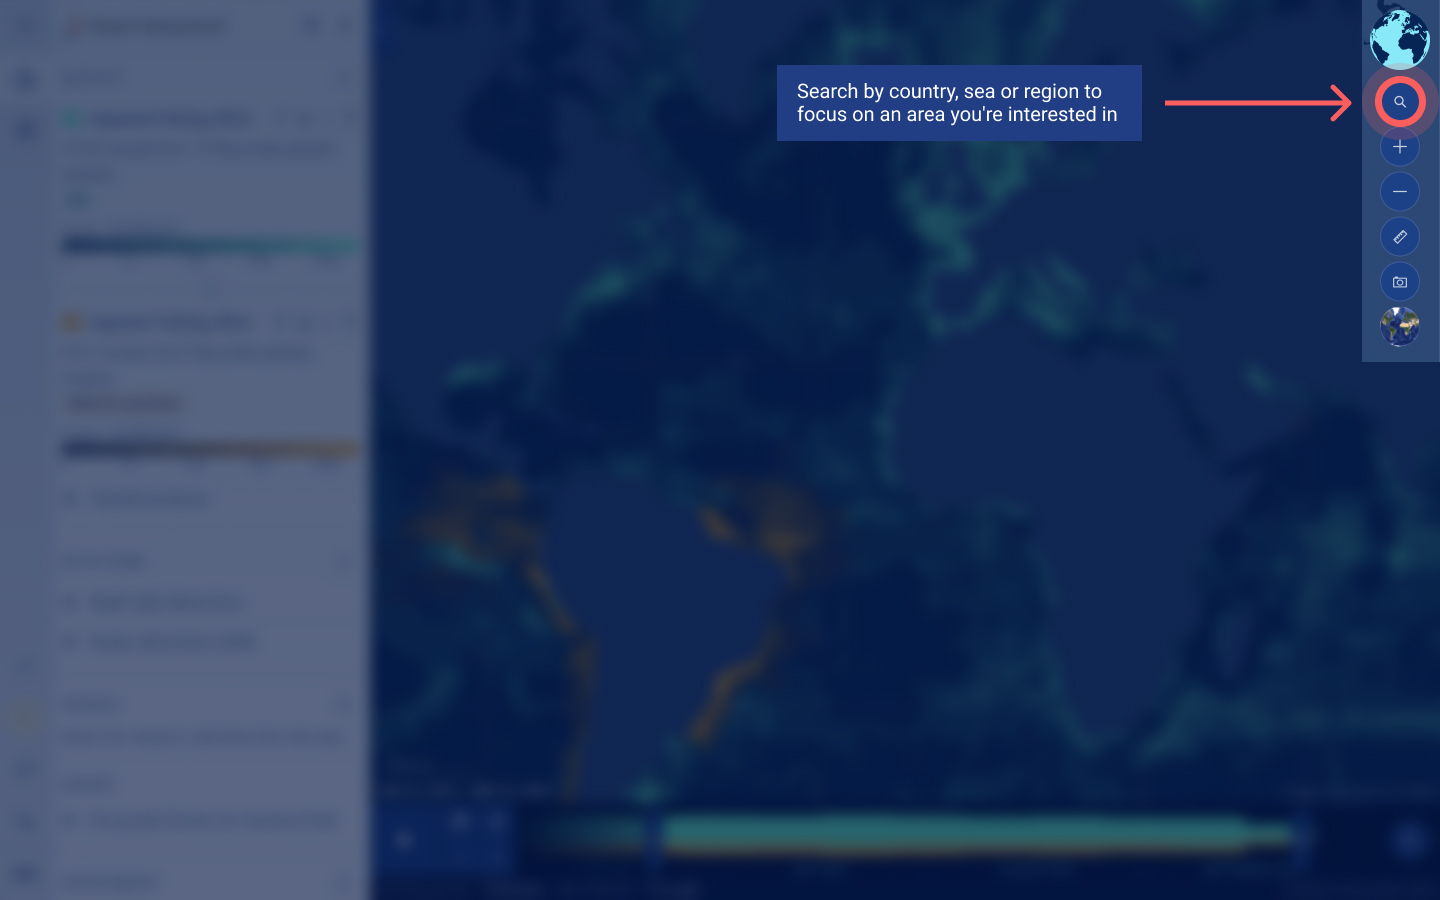
To move around the map, you can use your cursor to click and drag. To search for a specific region, including a country, marine protected area (MPA), or sea, you can use the “Search areas” icon on the right-hand side of the map.
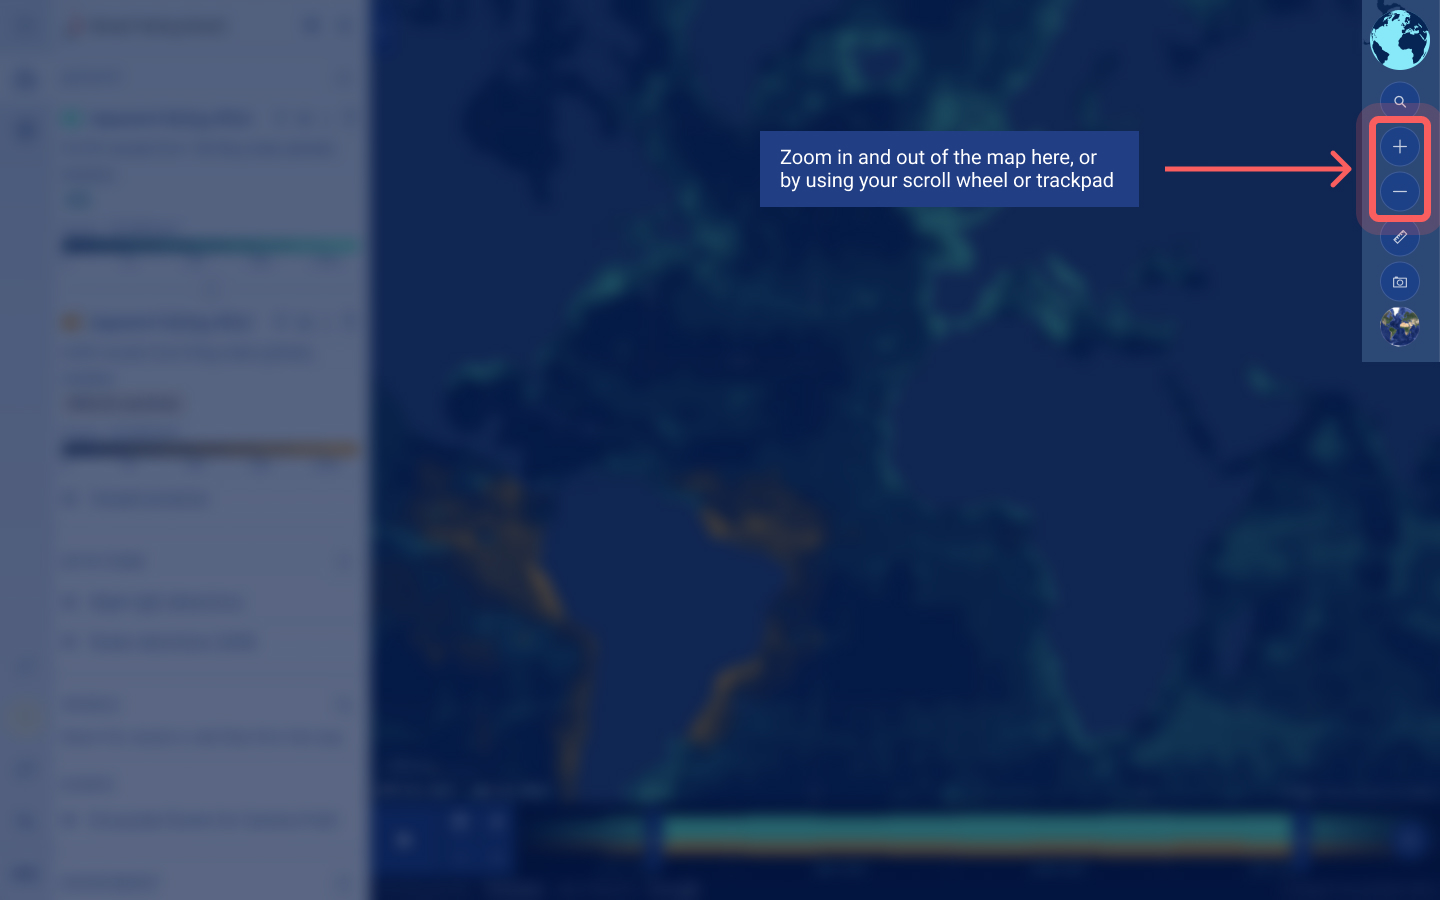
To zoom in and out, you can use your mouse wheel, trackpad, or the + and – icons located below the “Search areas” icon.
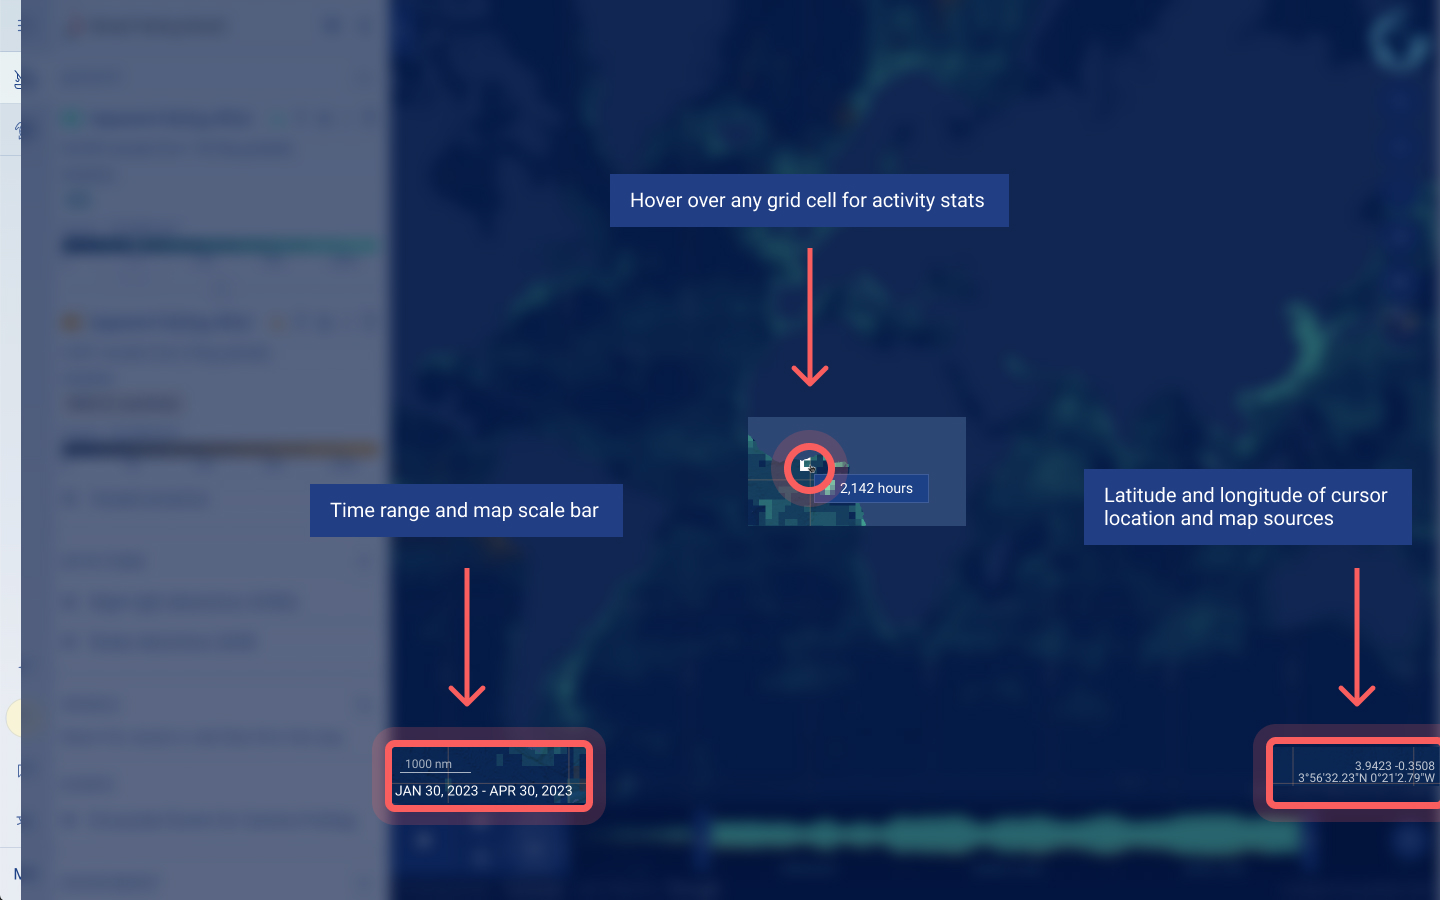
A scale bar at the bottom left-hand corner of the map will dynamically update as you zoom.
When you move your cursor around the map, the latitude and longitude for the location under the cursor will appear in the lower right-hand corner.
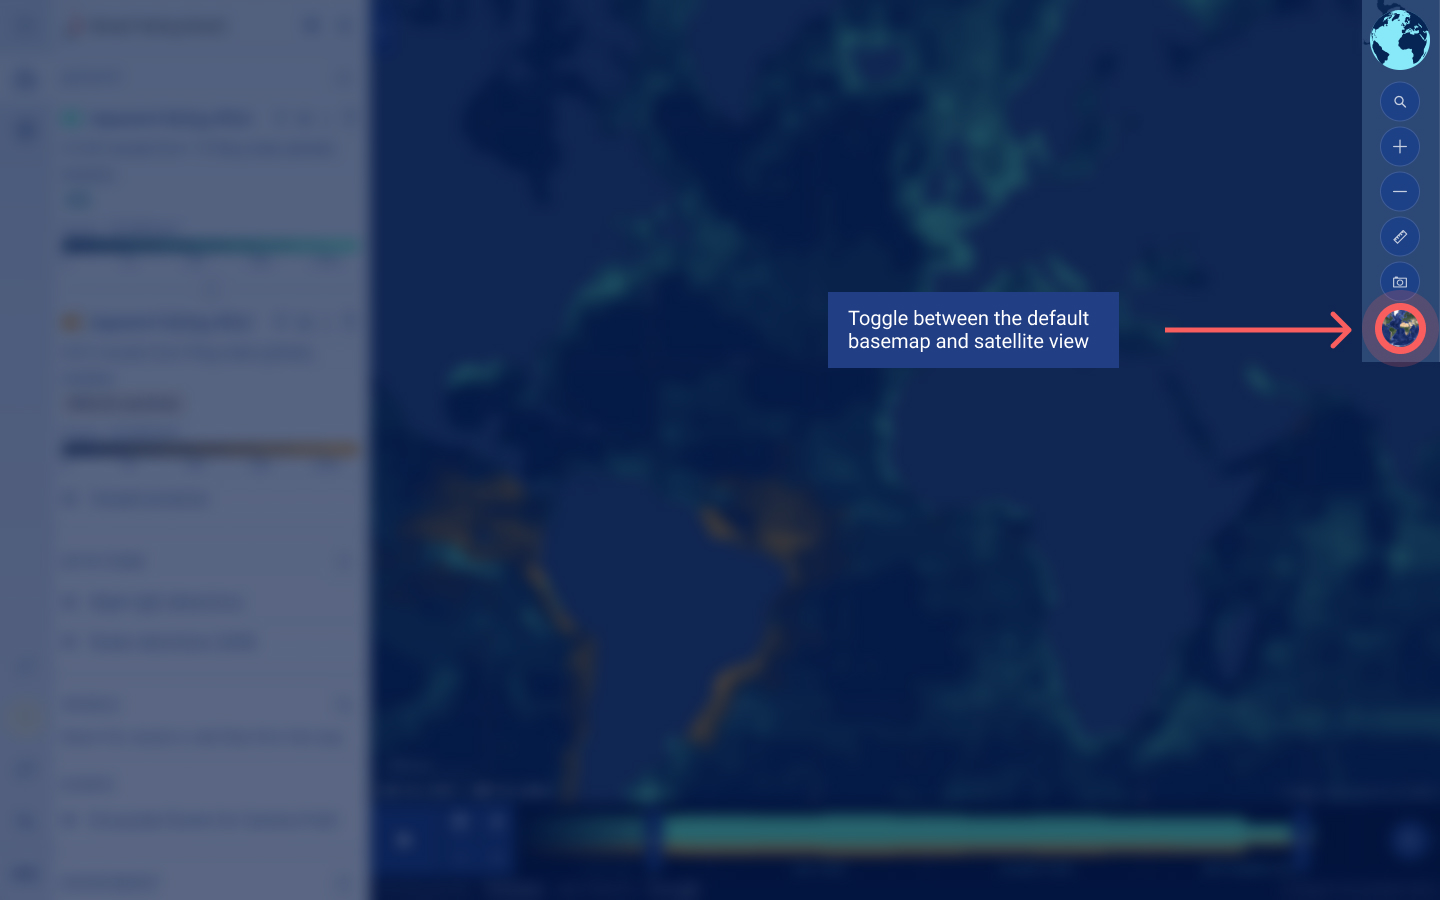
To change the basemap, you can click on the world icon located below the “Search areas” icon. You have the ability to switch between the default graphic basemap and a satellite view.
The map shows an interactive heat map of activity. The lighter grid cells are areas with greater activity, which is also highlighted in the layer’s scale. When you move the cursor within the map and pause on any given grid cell you can see the number of activity hours for the grid cell.
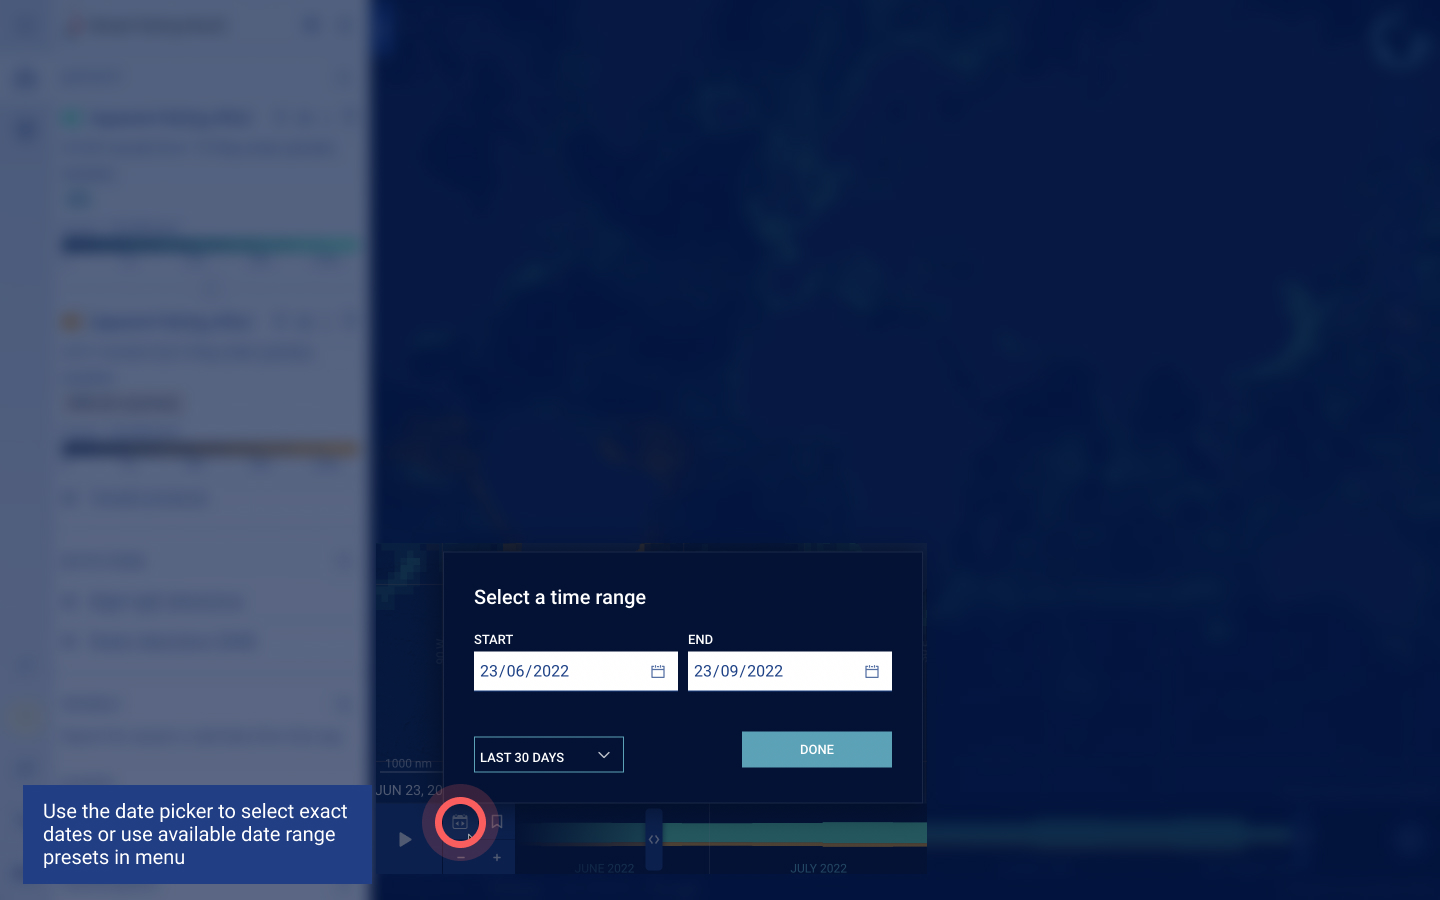
- The timebar is located at the bottom of the map and allows you to determine the time range for the data that is displayed on the map. To select a time range, you can:
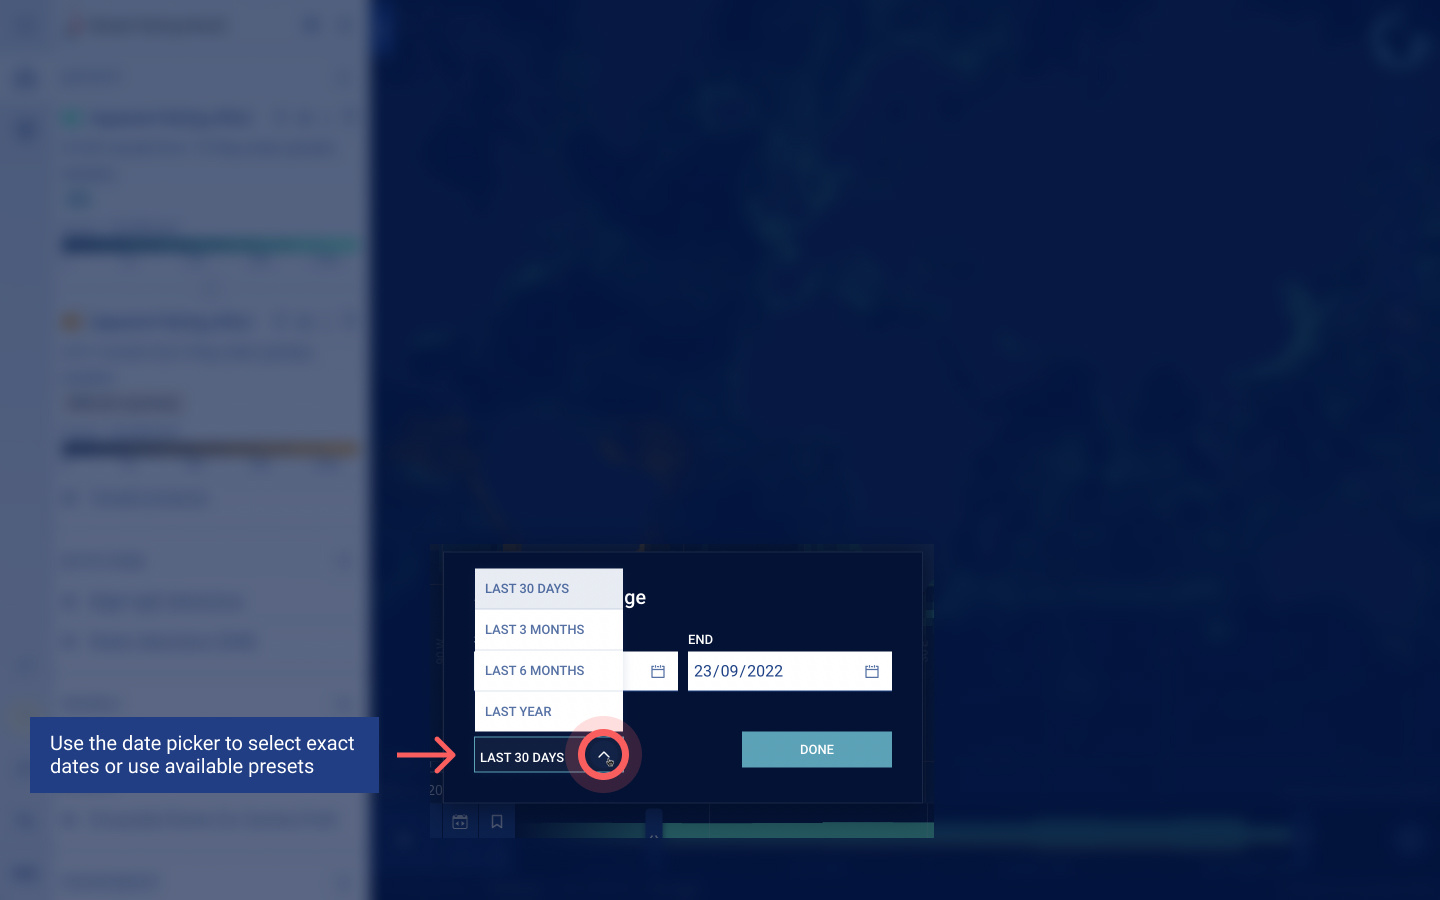
- Manually enter the time range using the date picker icon. You can select any time range from January 1, 2012, to up to 72 hours ago. Within the date picker, you can also select a pre-specified length of time, including “Last 30 days” and “Last 6 months.”
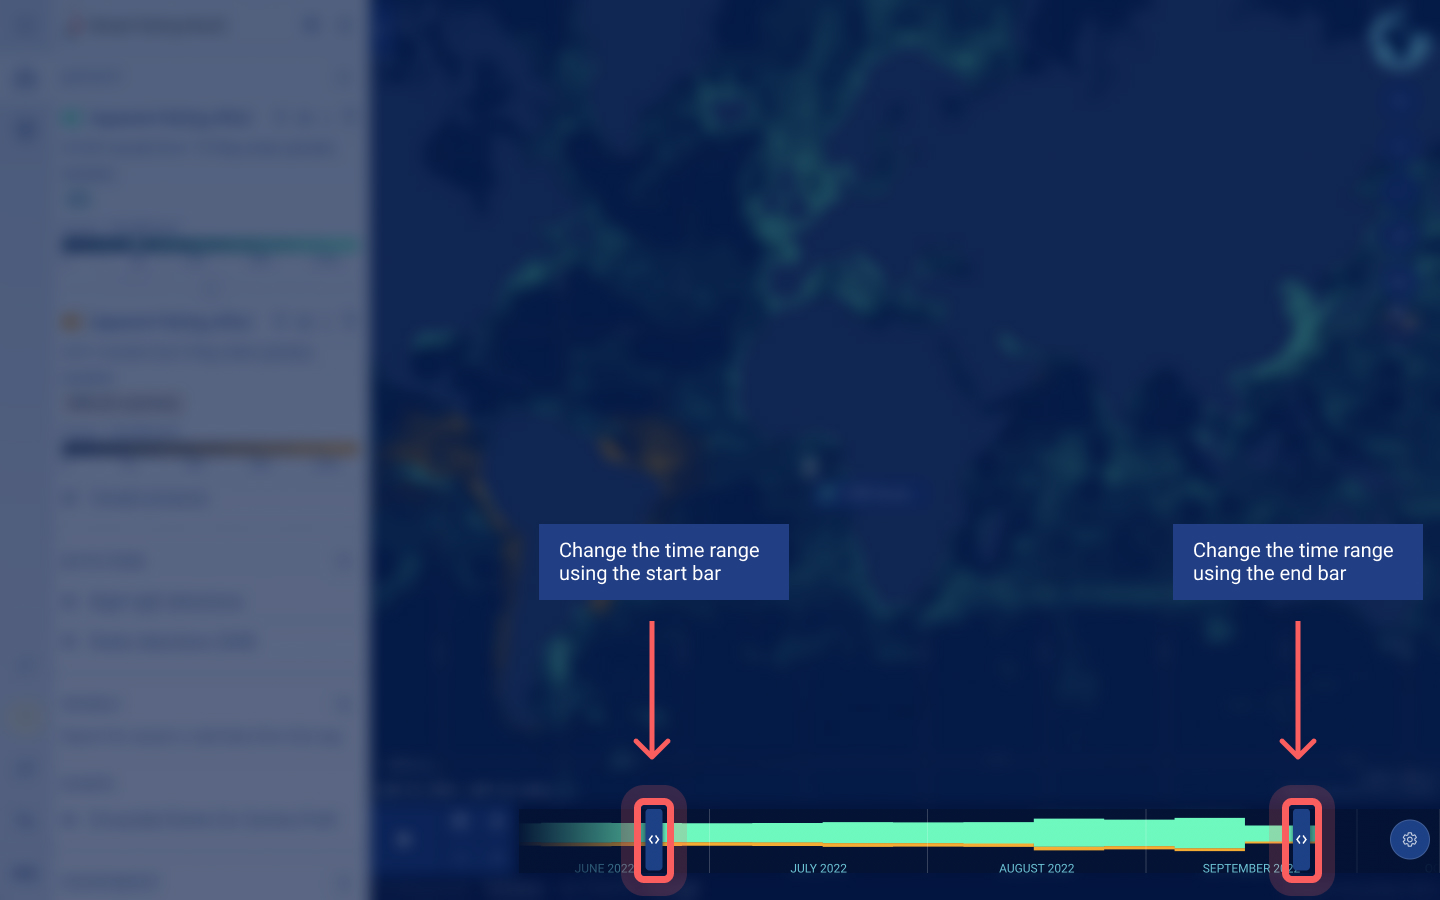
- Drag the start and end bars to change the time range.
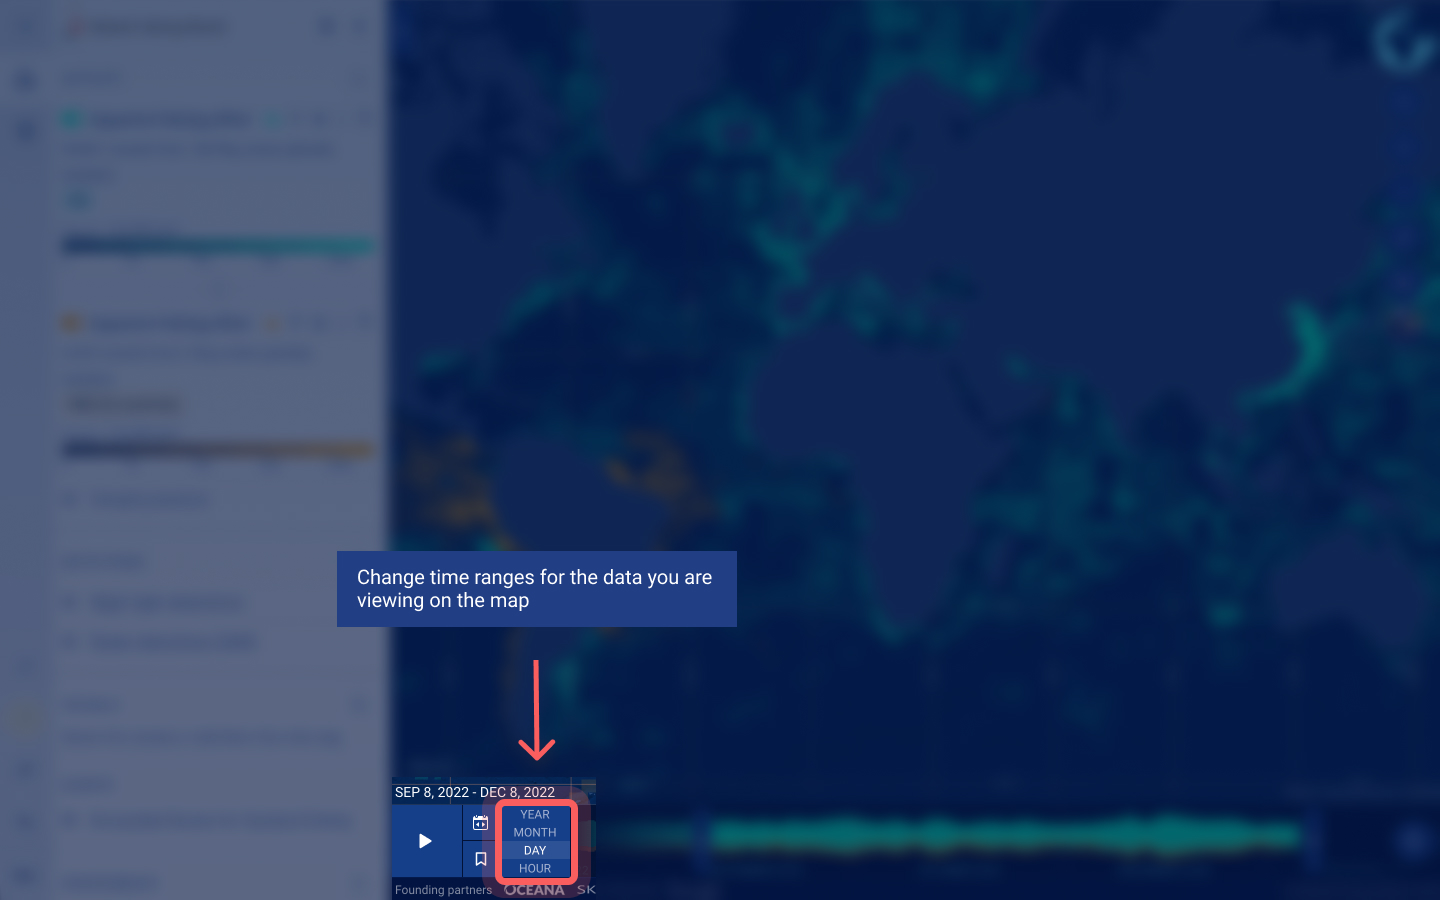
- Click on a year, month or day to select the time and zoom in further.
- If your time range includes the latest available data (e.g., the last 3 months of activity), the map will keep the most recent data in the new time range for you.
- If your time range does not include the latest available data (e.g., a previous year’s data), the update will snap to the middle of the previous range.
 Confirm that you have selected your intended time range by referring to the dates shown above the date picker icon.
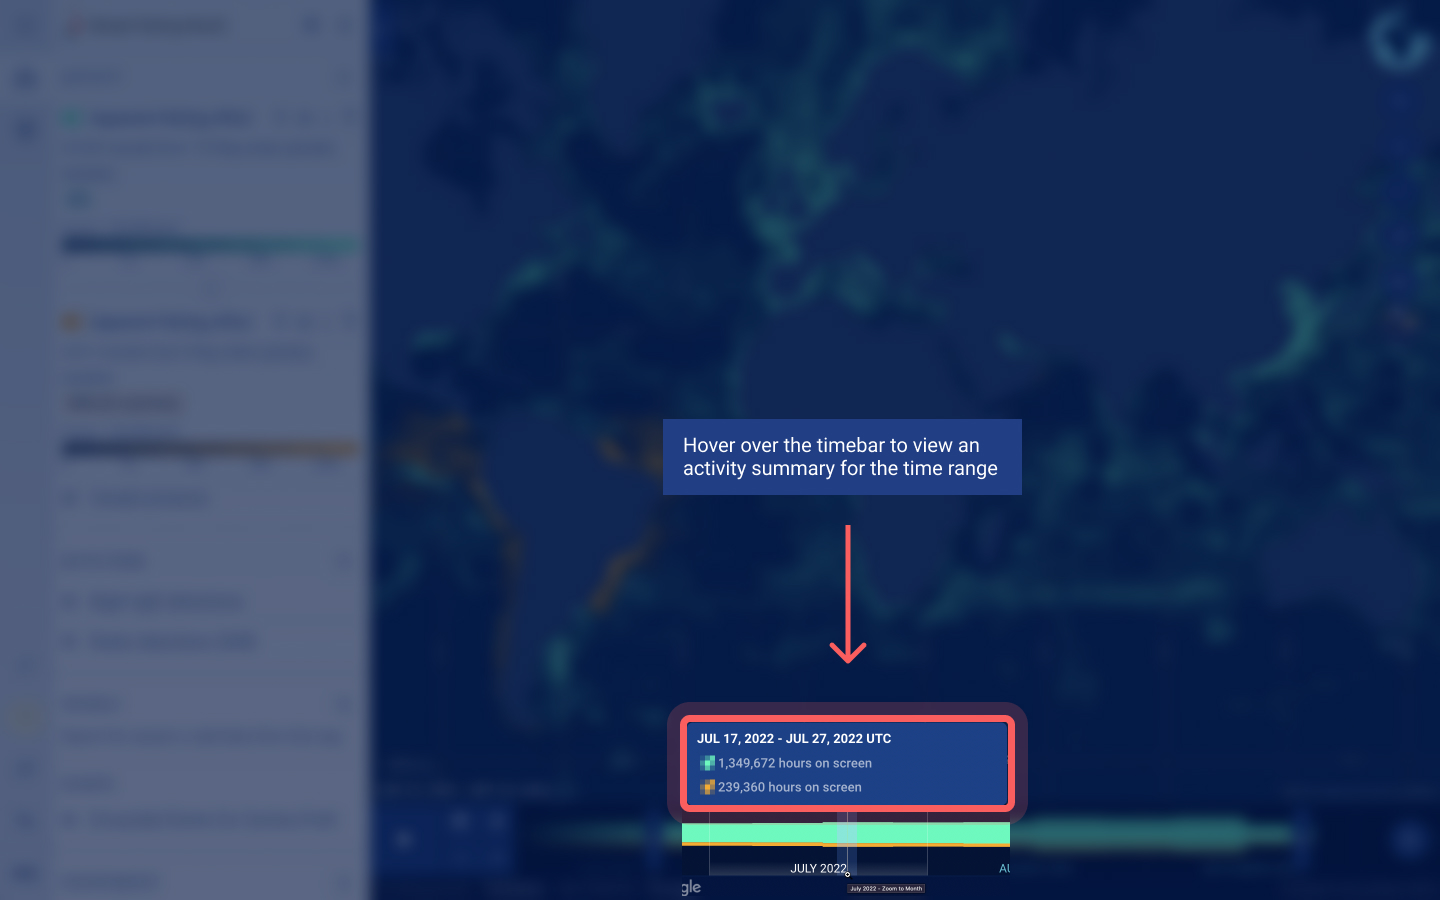
You can animate activity and vessel data on the map using the timebar.
The initial window between the start and end bars determines the time range that is presented on the map at any given point during an animation–the animation can show a rolling week, month or any specific length of time. If you would like the animation to move more incrementally through the data, you can select a shorter time range.
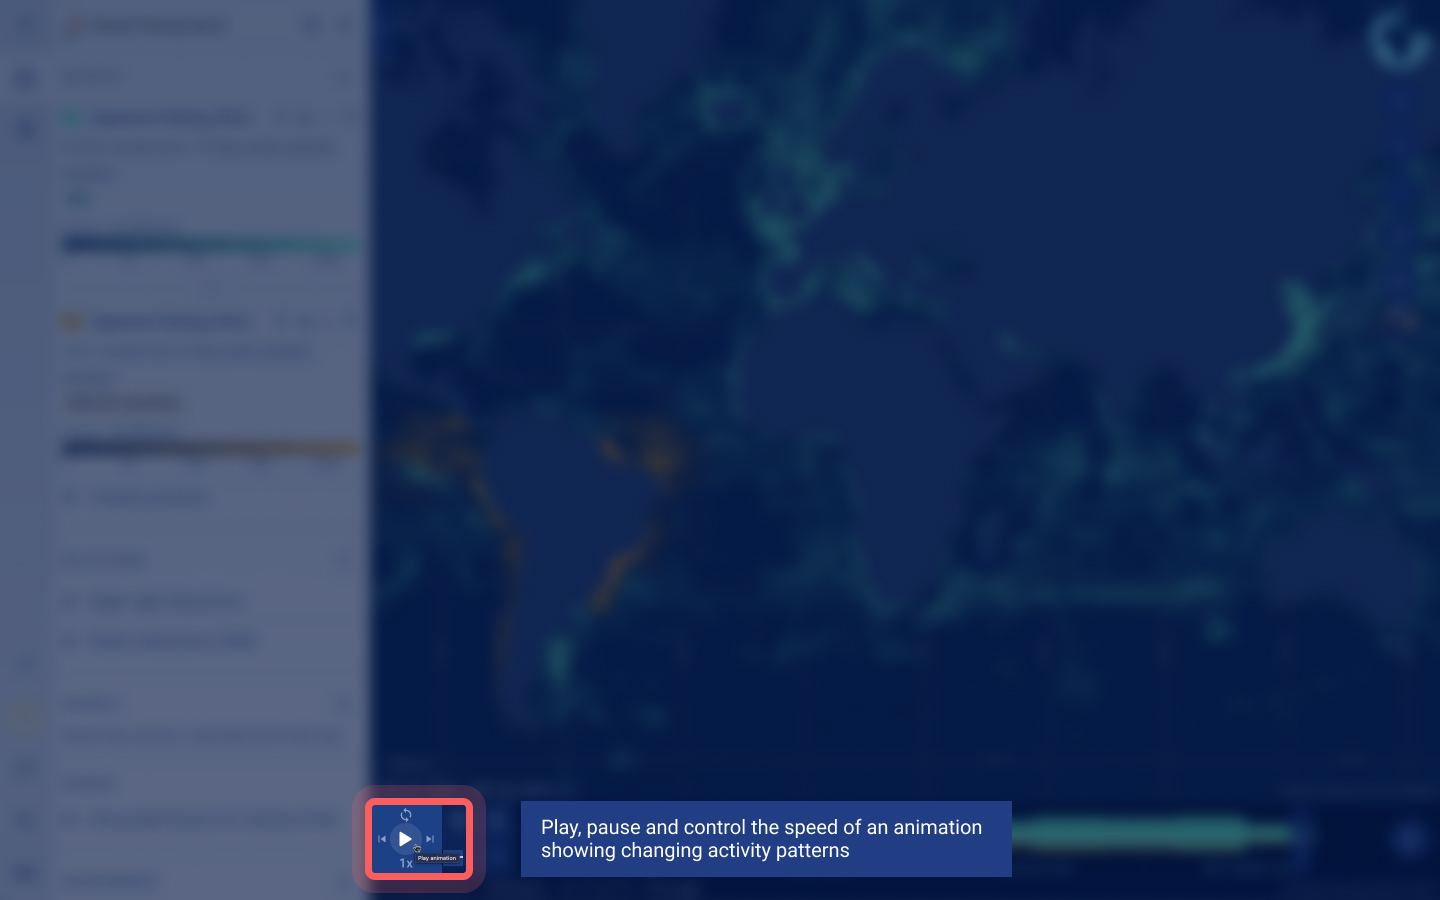
When you press the play button within the animation feature, the animation will continue until around today’s date. You can change the speed of the animation by pressing the 1x button beneath the play button consecutively until you reach your desired speed.
If you set the end bar at today’s range, the animation feature will not work as there is no subsequent activity. Set the end bar at least 72 hours prior to the current time to ensure the animation runs and earlier if you would like a longer animation.
You can also loop the animation, by selecting the “Toggle animation looping” above the play button. The loop animation goes back to the start of the available data after it has reached today’s date.
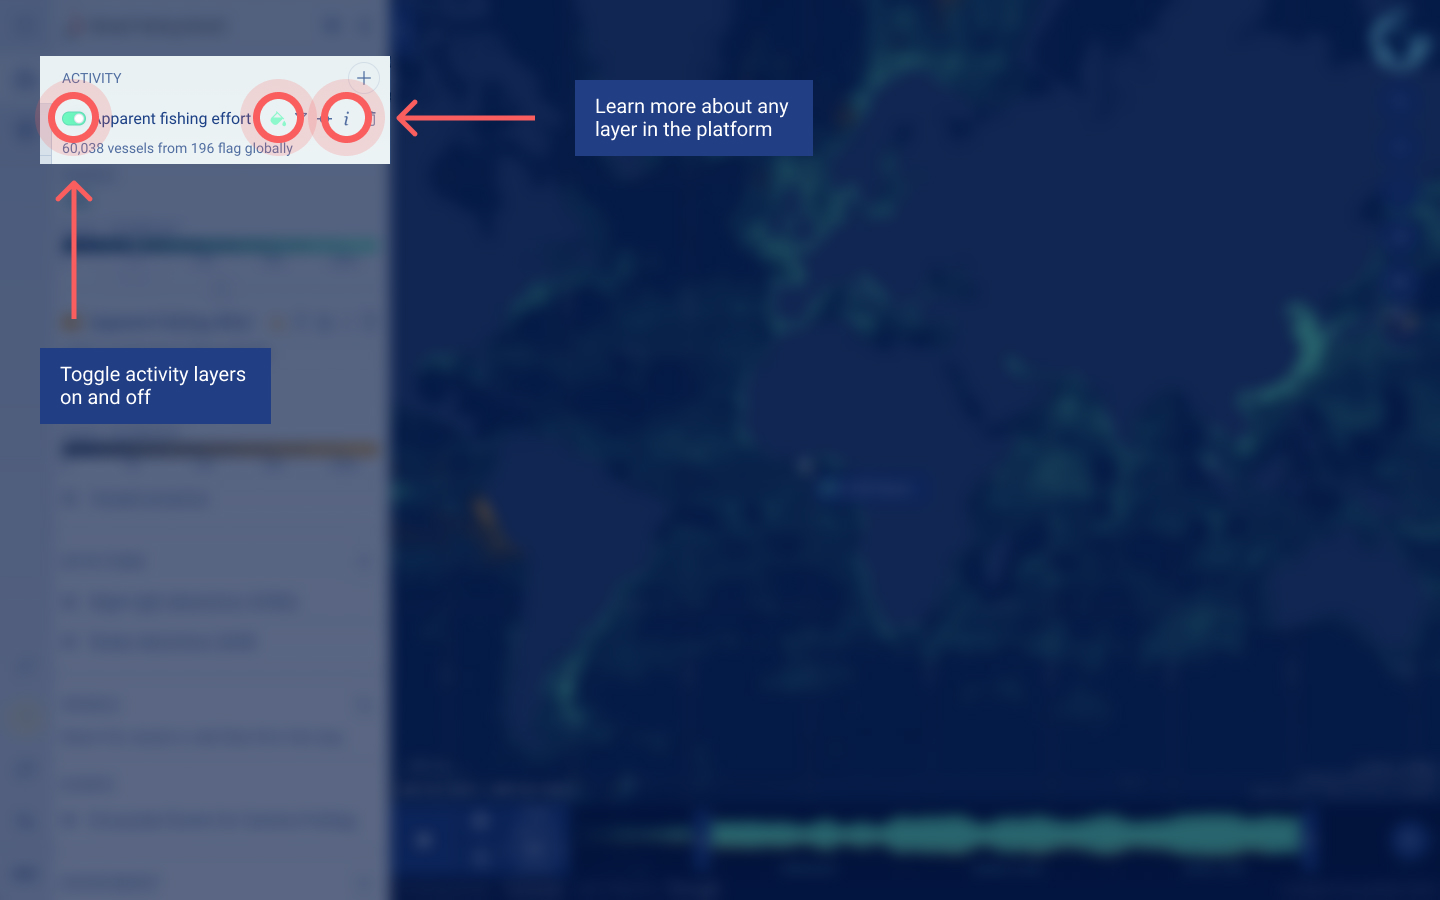
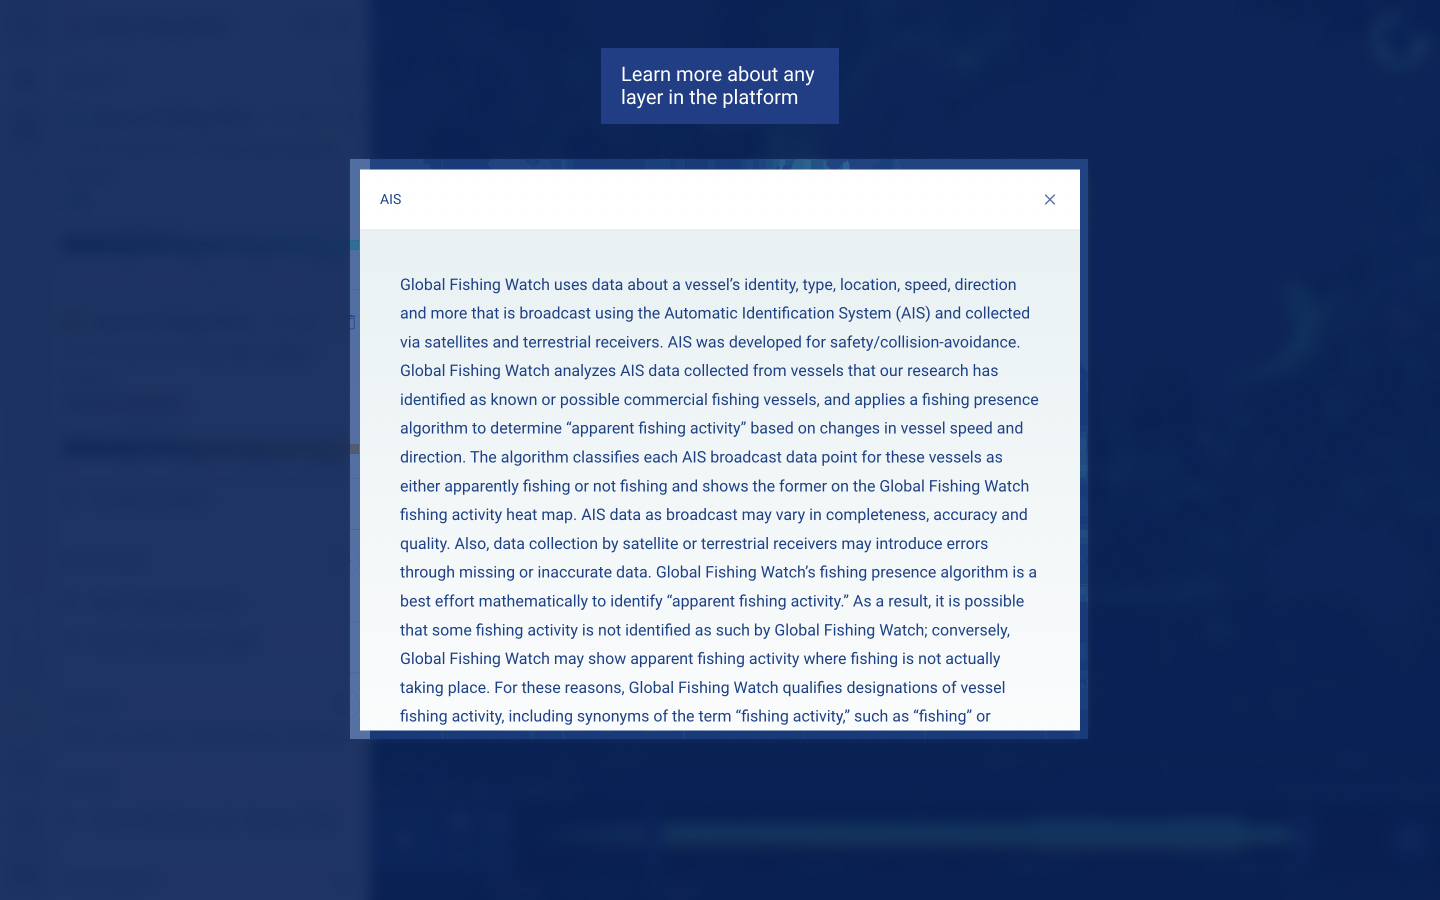
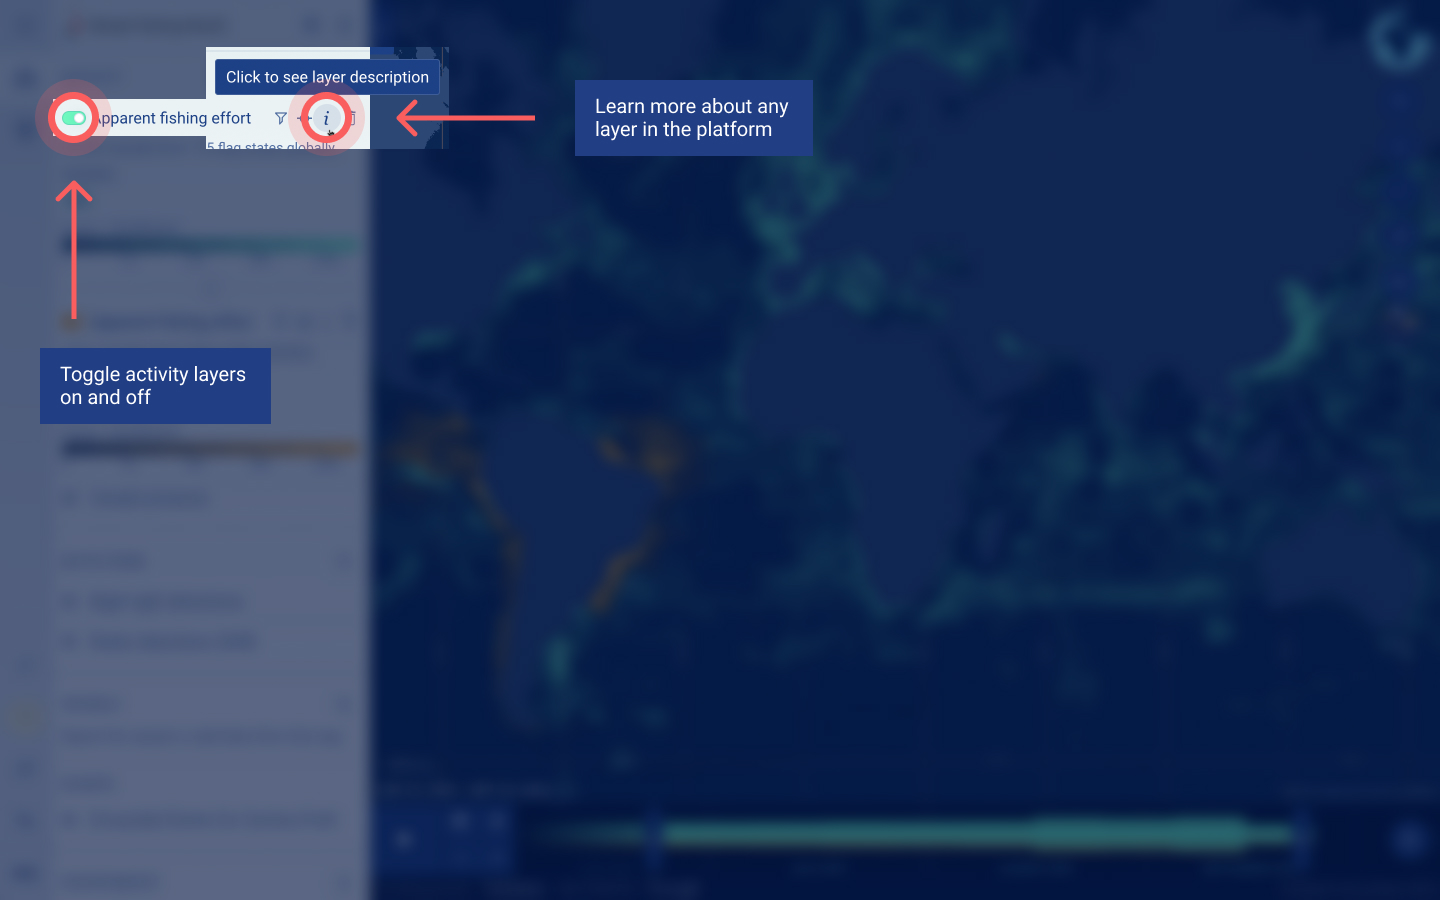
To learn more about each layer, including the methodology and data source, click on the “i” icon beside each layer.
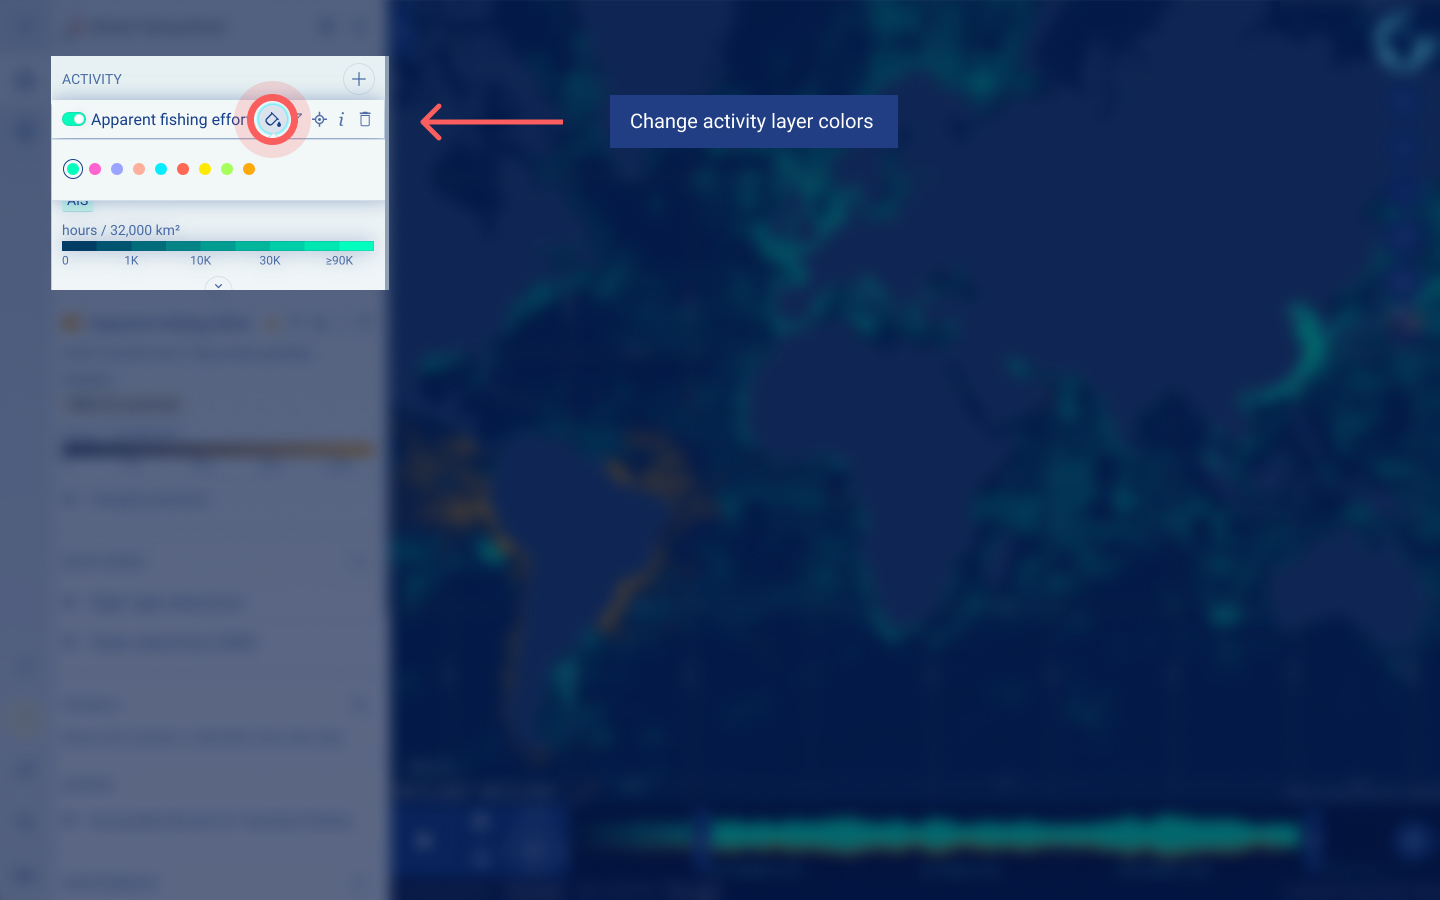
You can also customize each activity layer based on your preference, altering what is present within the spatial activity map.
- To change the color of any activity layer, select the paint icon.
- To center the map on a specific activity layer, select the compass icon. This is useful if you have filtered activity by vessel groups and are only viewing a small amount of activity.
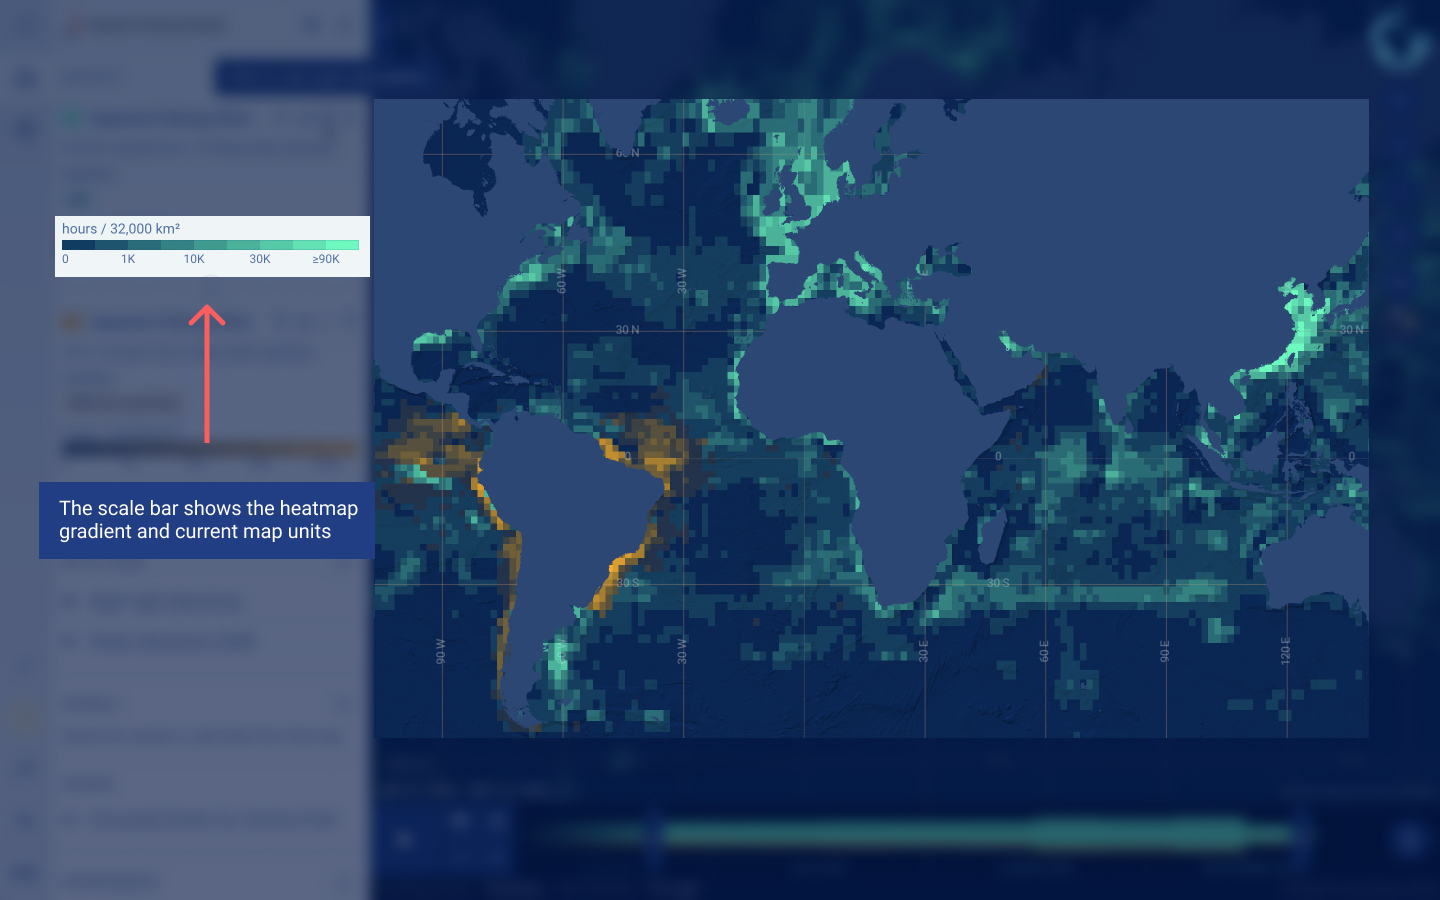
When you toggle on a layer, there will be a scale that will appear underneath the layer title in the sidebar. The scale will dynamically adjust as you zoom in and out within the map and the point on the scale reflects where your cursor is on the map.
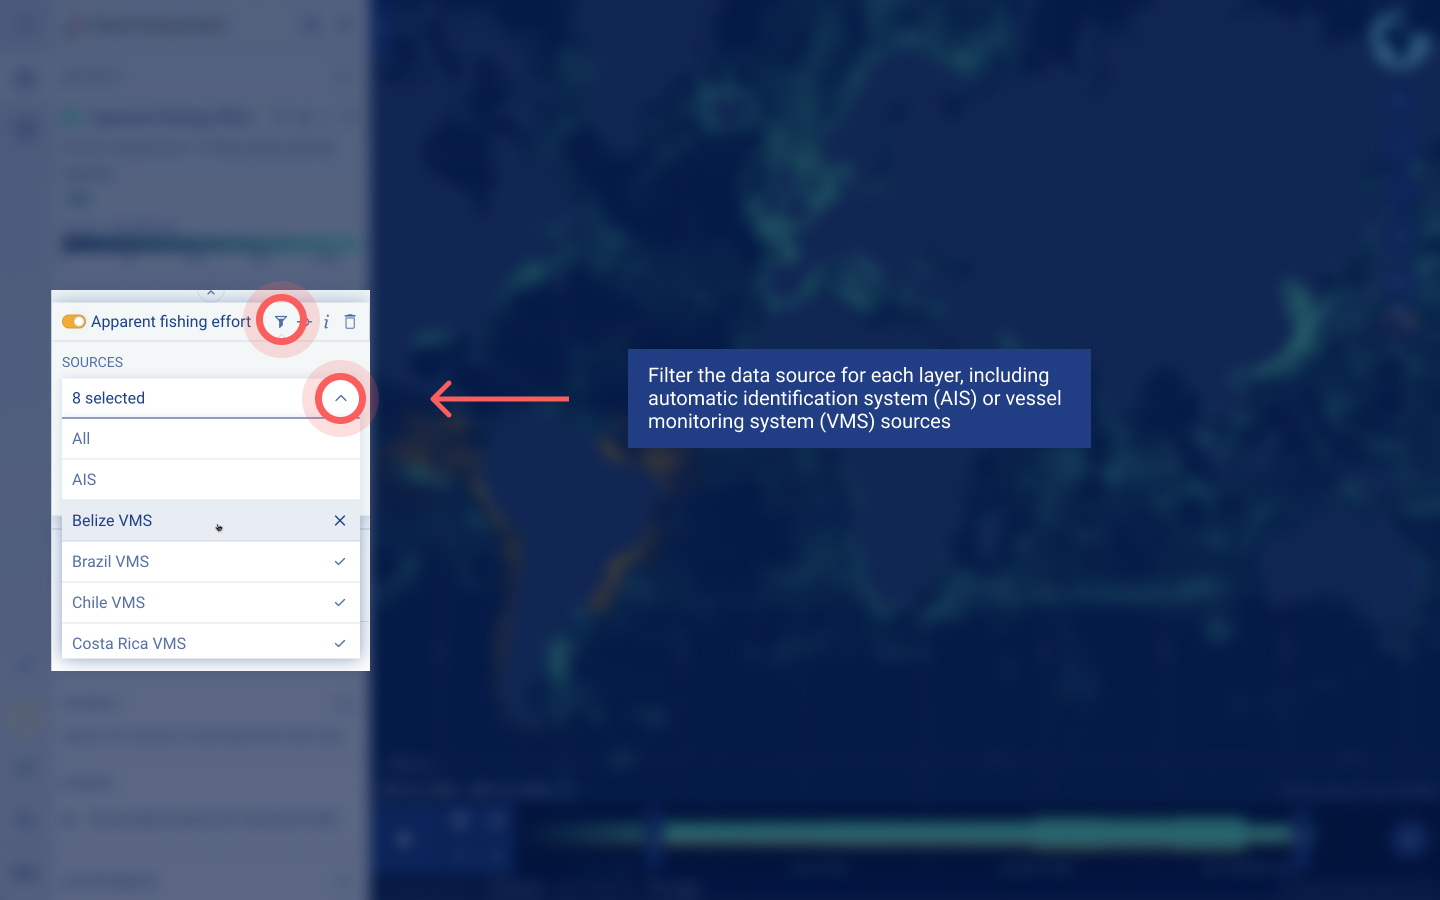
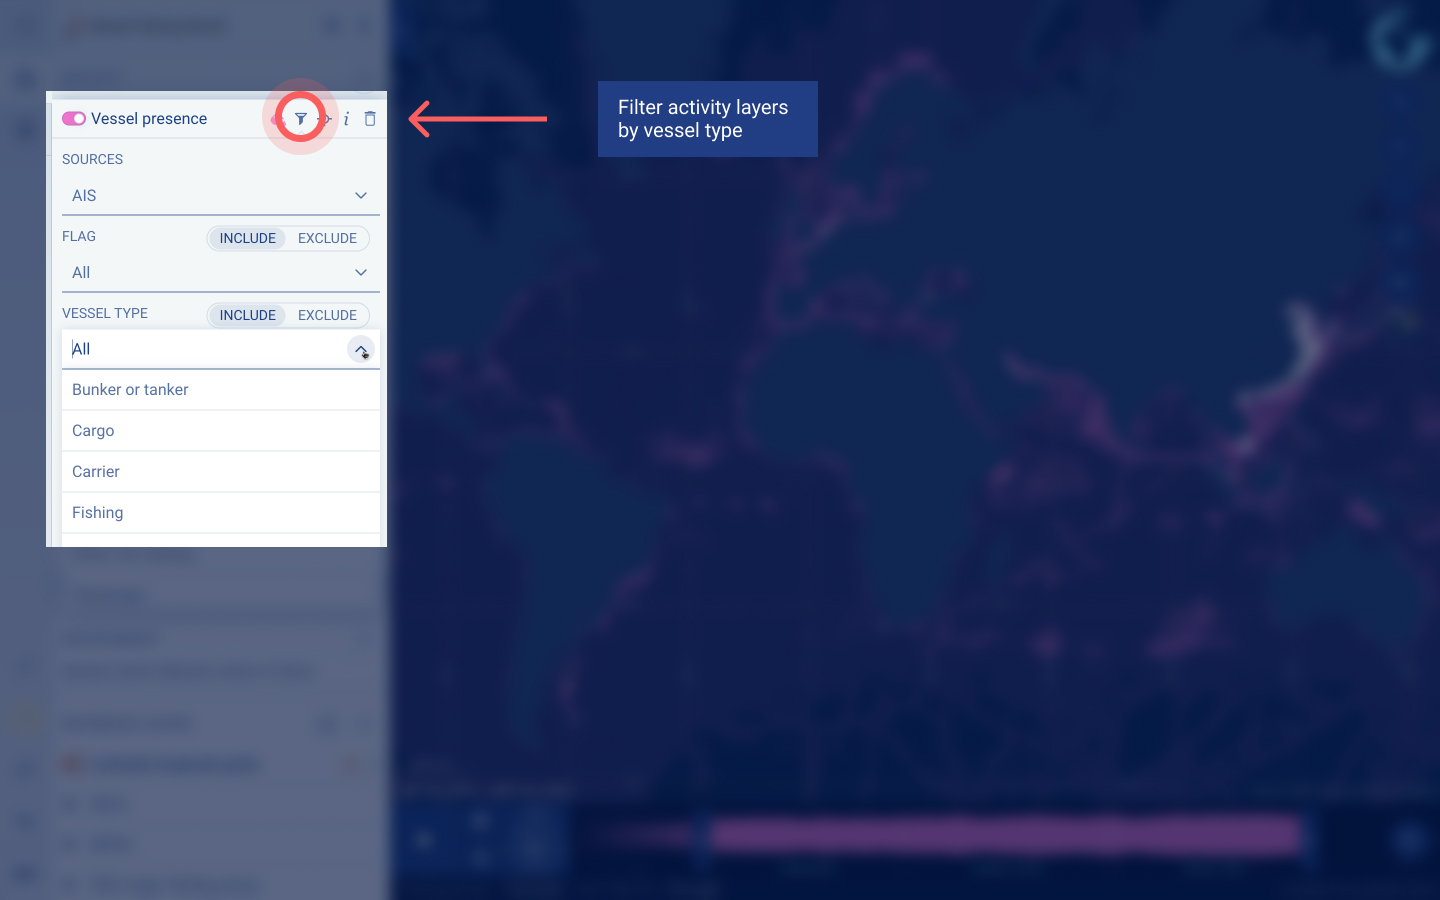
You can filter the data within each layer to view a subset of the fishing activity. To access the filters, click the filter icon beside the layer. While there are common filters across the layers, certain layers also have unique attributes that you can filter. You have the option to filter by data source, AIS or VMS.
Based on the data source:
- AIS data can be filtered by flag and gear type.
- VMS data can be filtered by flag and, in some cases, by gear type, fleet and origin.
Some filters may be hidden if both AIS and VMS layers are used as the source in a single apparent fishing effort layer.
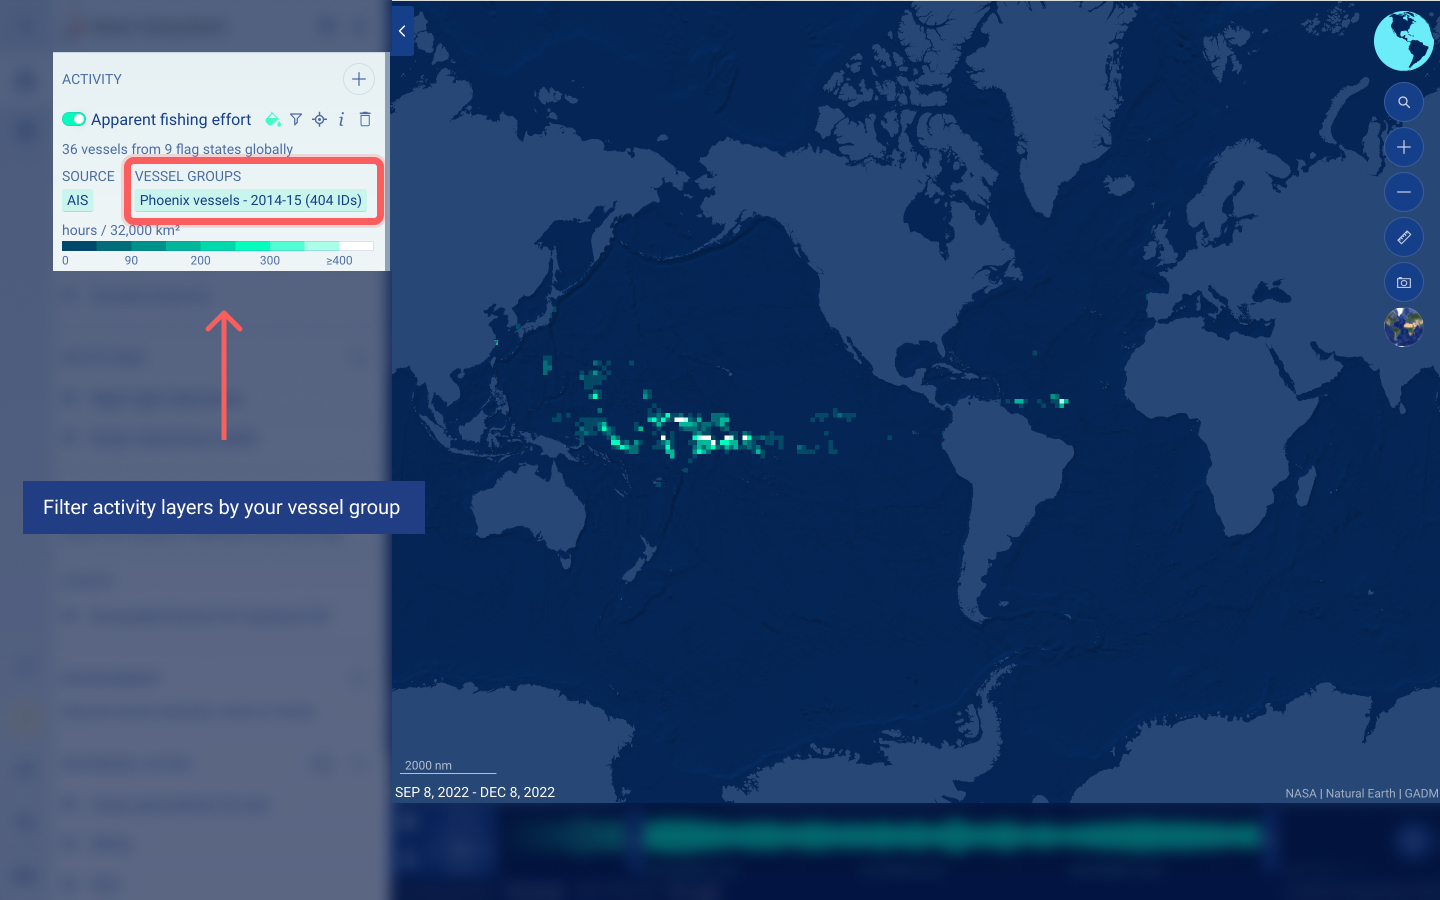
You can also filter the activity layers by a subset of vessels by creating a vessel group.
In the left sidebar beside ACTIVITY, you can create new fishing effort layers by clicking the add layer icon .
- To be able to see or turn on an existing layer, toggle the layer on using this button. When the layer is visible, the toggle will be highlighted with a color, instead of gray.
- Click the filter icon of the layer you want to filter by gear type.
- Select Source = AIS.
- Select Gear type = Set longlines.
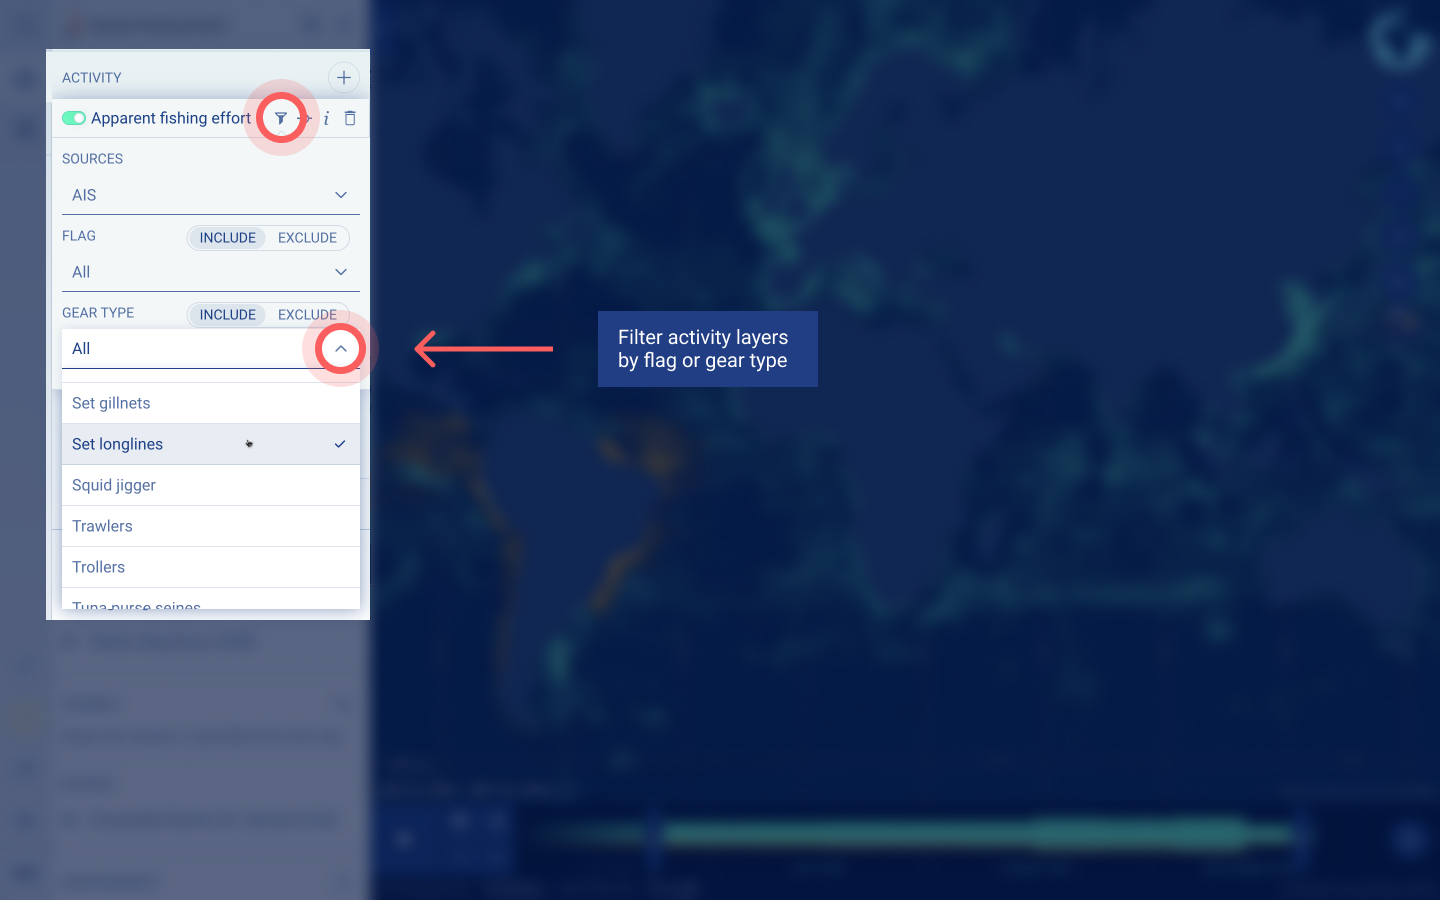
- To zoom into an area, use your cursor or the “search areas” icon to navigate to Argentina and explore the fishing activity from set longlines.
- Click play within the timebar to see Argentina’s fishing effort over time.
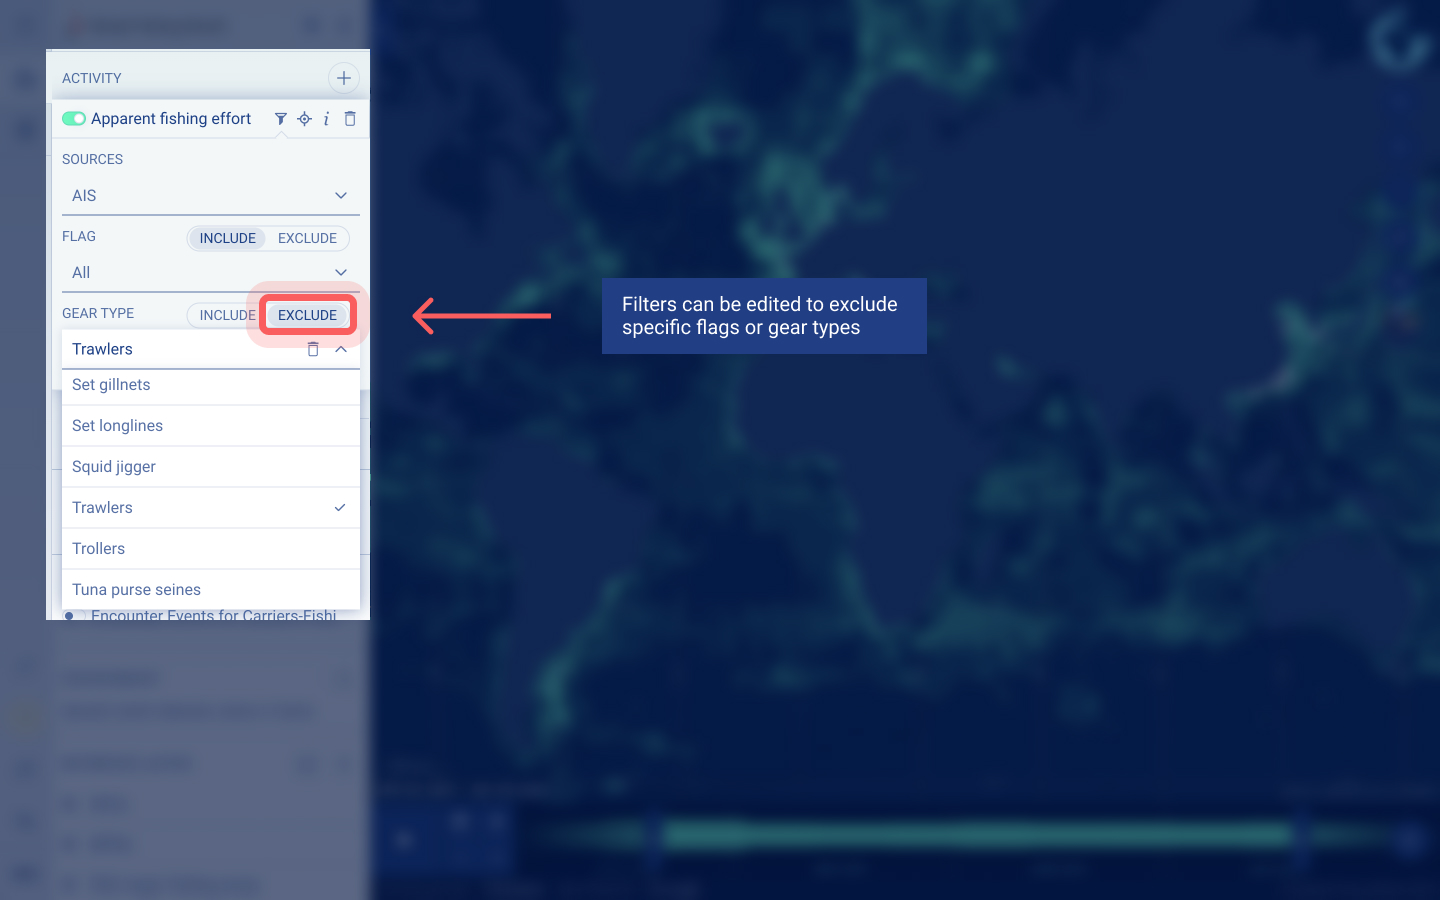
- Alternatively, if you would like to exclude a specific flag or gear type, click on the “Exclude” button before selecting your filter options. This could be useful to see where foreign flagged vessels may be active in a specific EEZ or MPA.
- To learn more about a layer, click the information icon. To delete a layer, click the delete icon .
- In the left sidebar under ACTIVITY create two fishing effort layers by clicking the add icon .
- For the first layer, click the filter icon and:
- Select Source = AIS
- Select Flag = China
- For the second layer, click the filter icon and:
- Select Source = AIS
- Select Flag = Republic of Korea and Spain
When you have created the two layers of apparent fishing effort, it is possible to compare the layers visually.
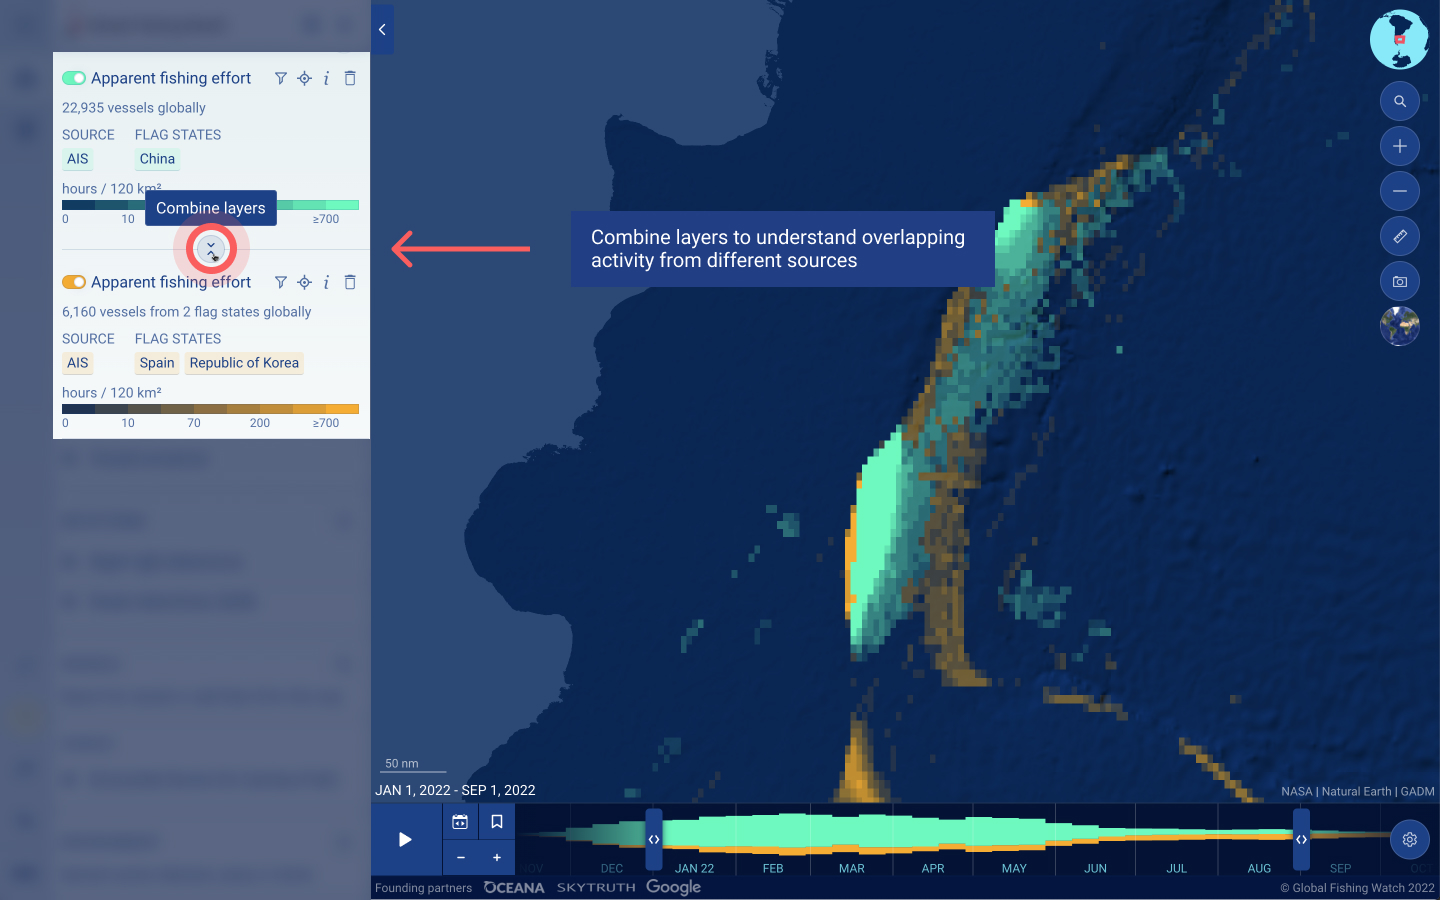
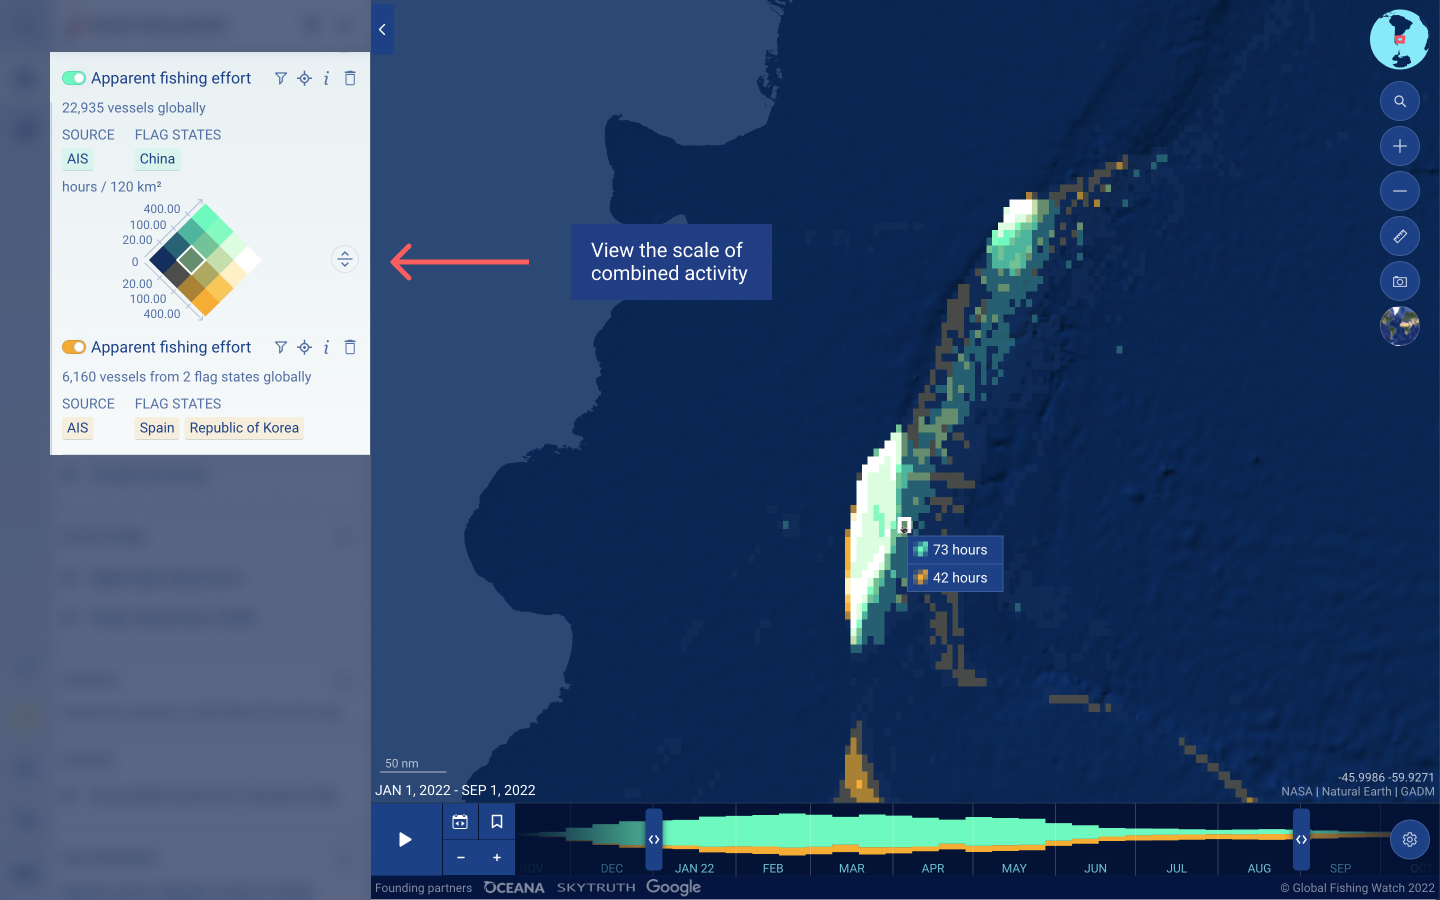
However, to see the nuance, click on the combine layers icon . This enables you to see where the fishing effort is shared between fleets, or if one fleet has more fishing effort within any specified area. When there is limited fishing effort present from either layer, the color is transparent.
The vessel presence layer, which you can find underneath the apparent fishing effort layers in the left sidebar, analyzes AIS data collected from vessels that our research has identified. Unlike the apparent fishing effort layers, the presence layer is not limited to fishing vessels. The presence is determined by taking positions transmitted by the vessel’s AIS and is displayed as a heatmap.
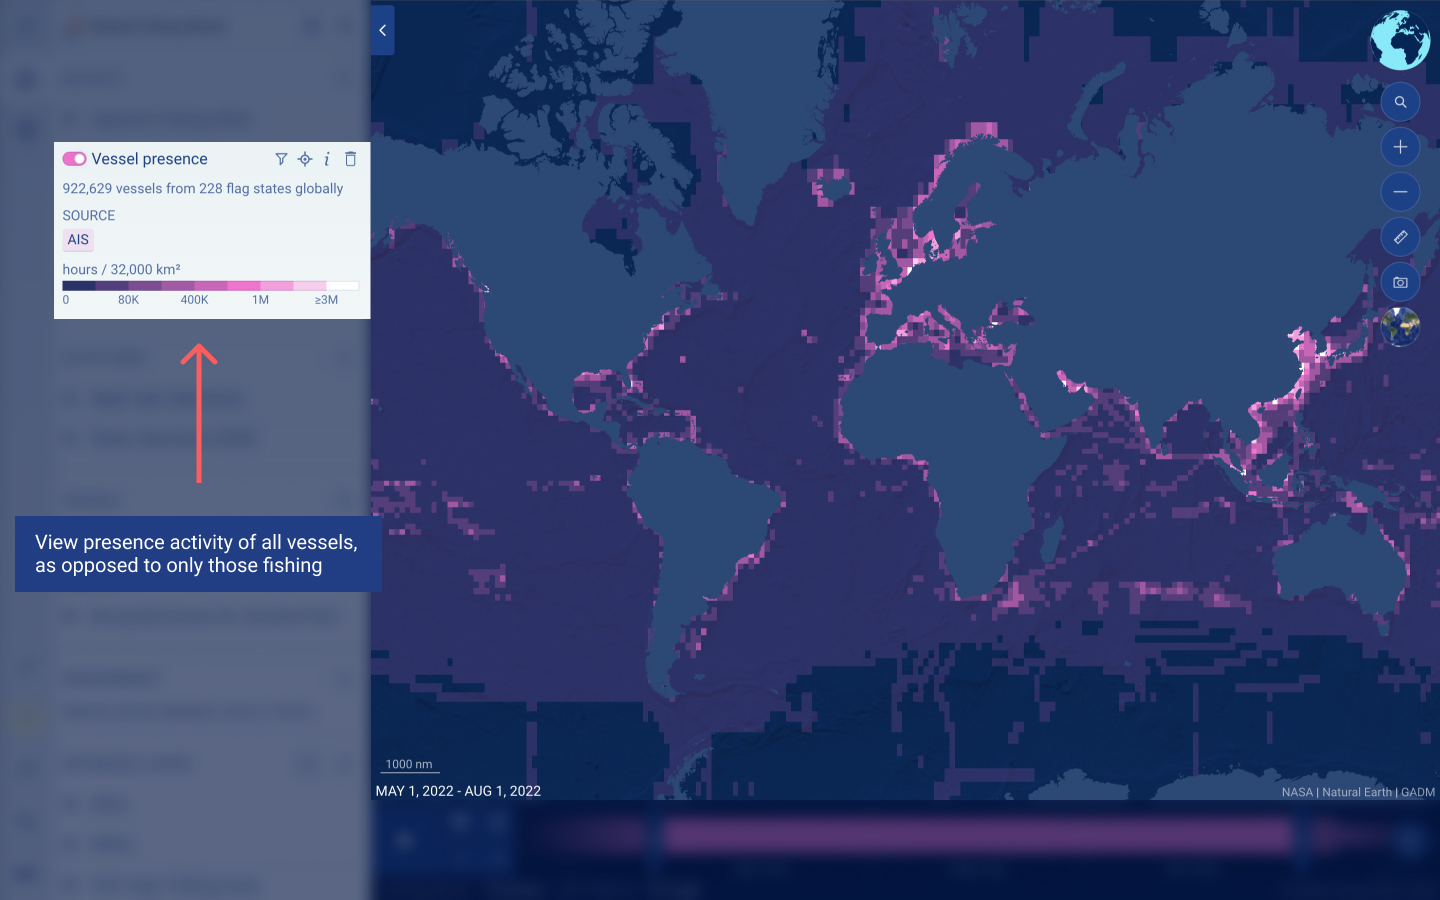
Using the filter icon, the presence layer can be filtered by fishing, carrier and other vessel types.
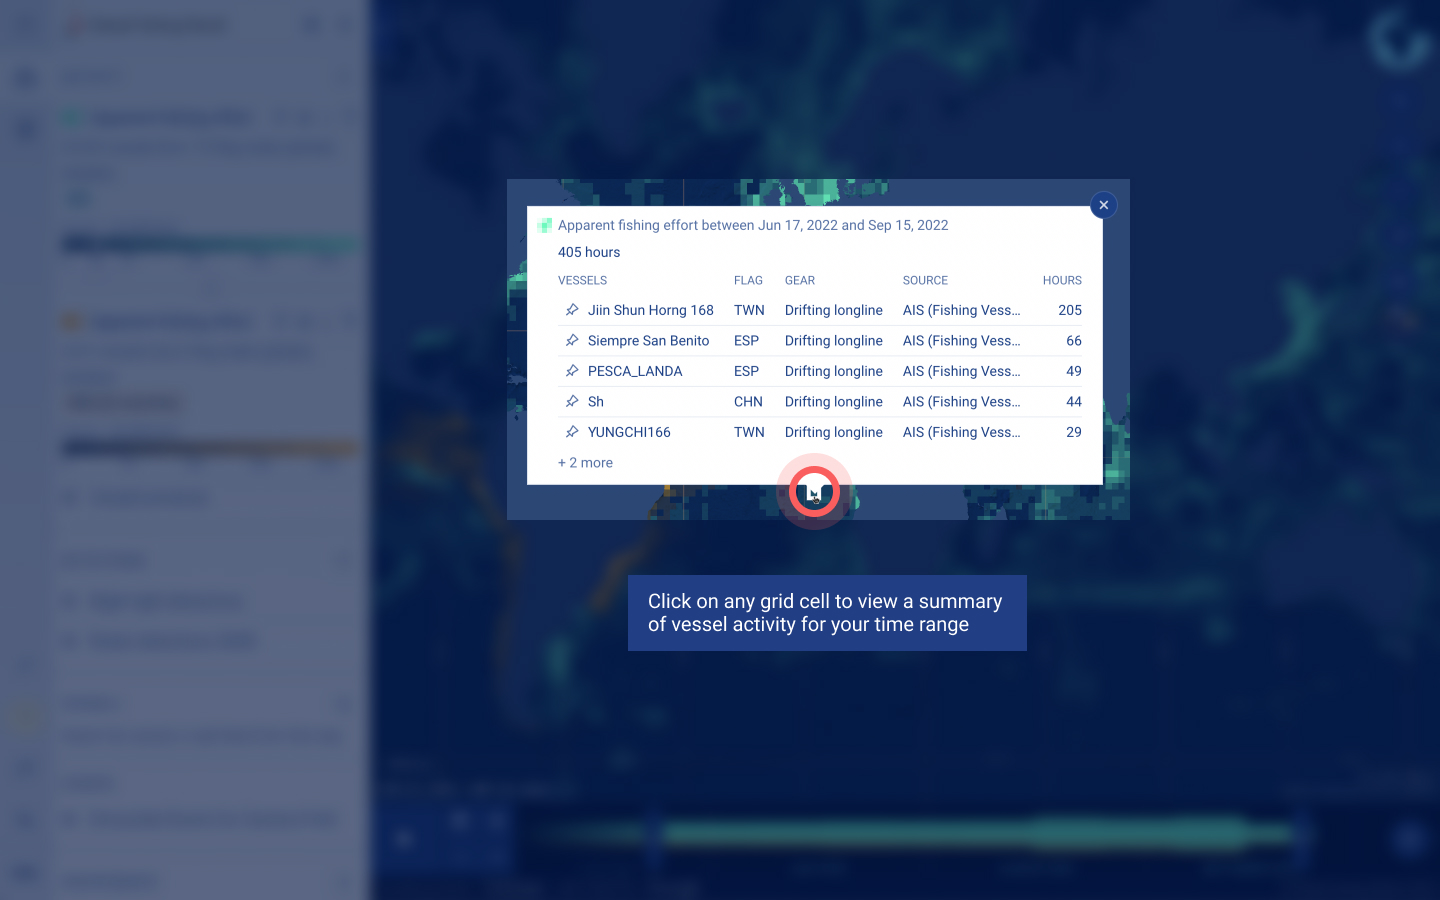
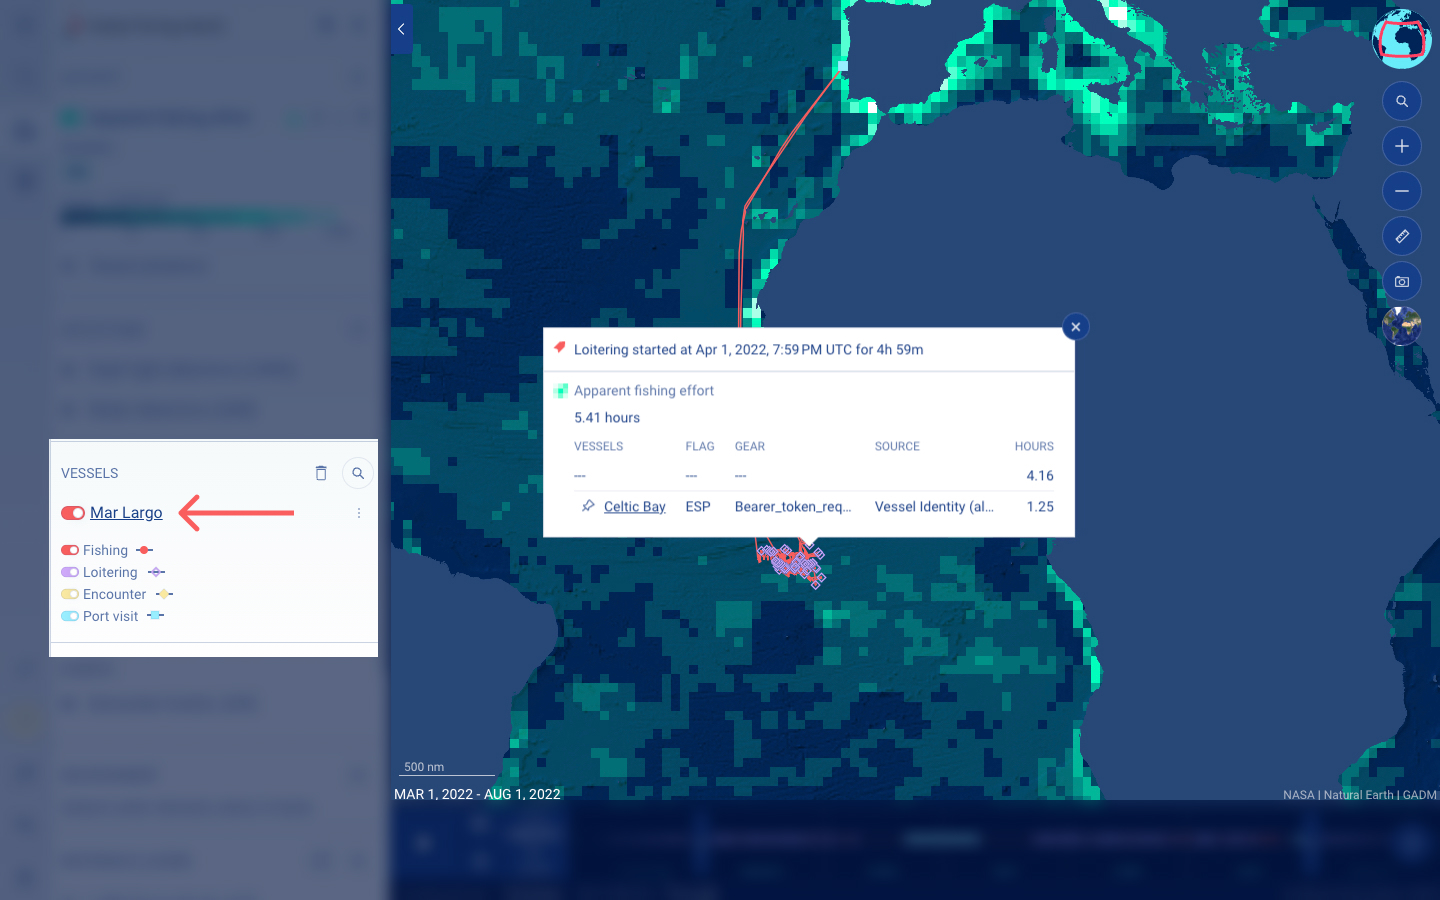
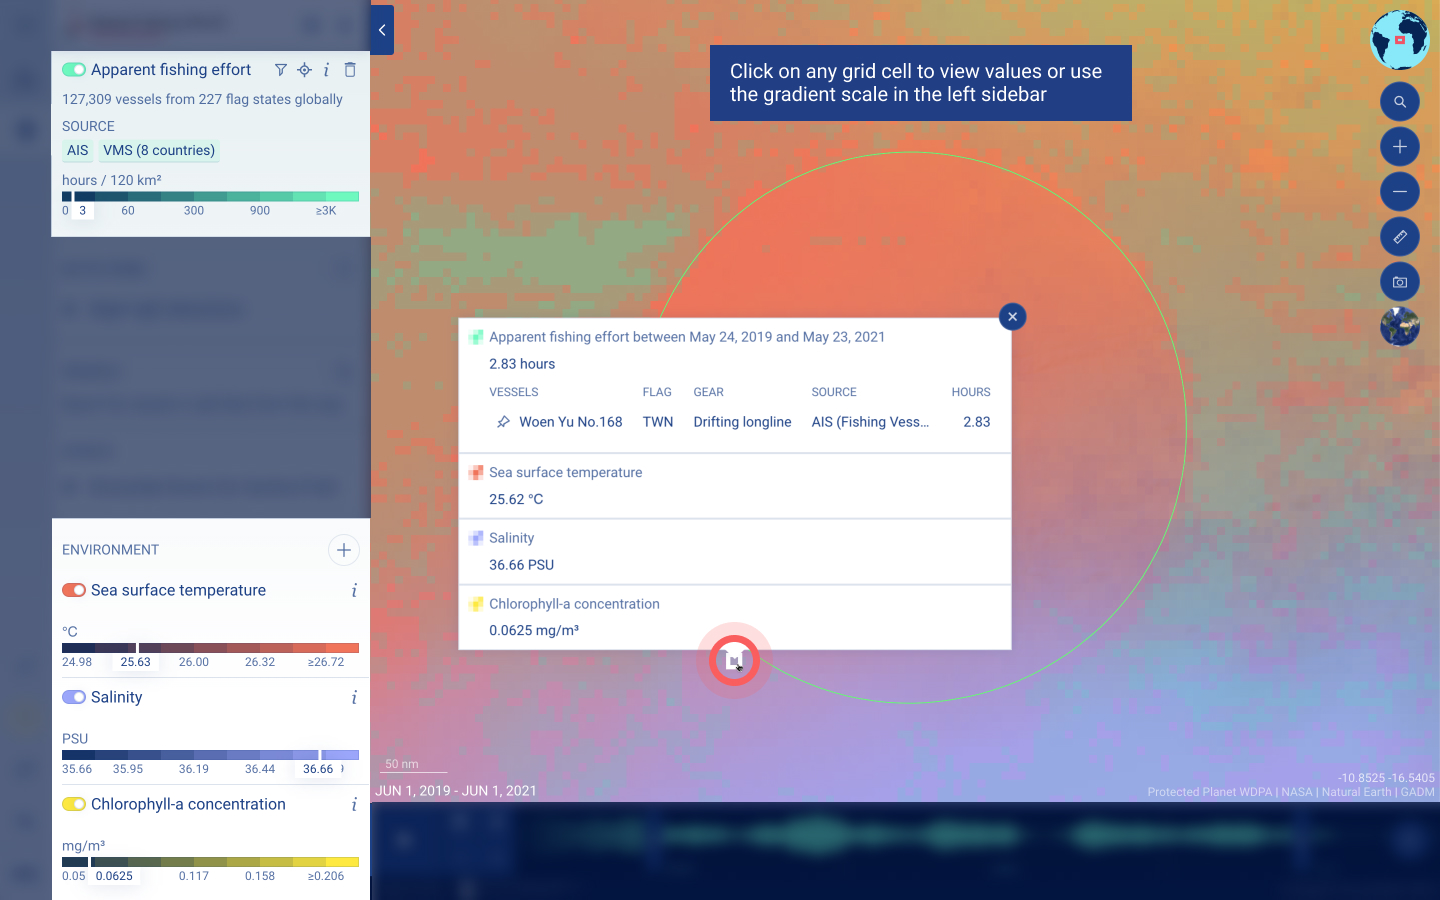
When one or more activity layers are toggled on, click on any grid cell that you are interested in exploring further and there will be a pop-up with a list of vessels engaged in the most activity over the specified time range. Fishing activity is represented as hours of apparent fishing effort and vessel presence is represented as hours present within a grid cell.
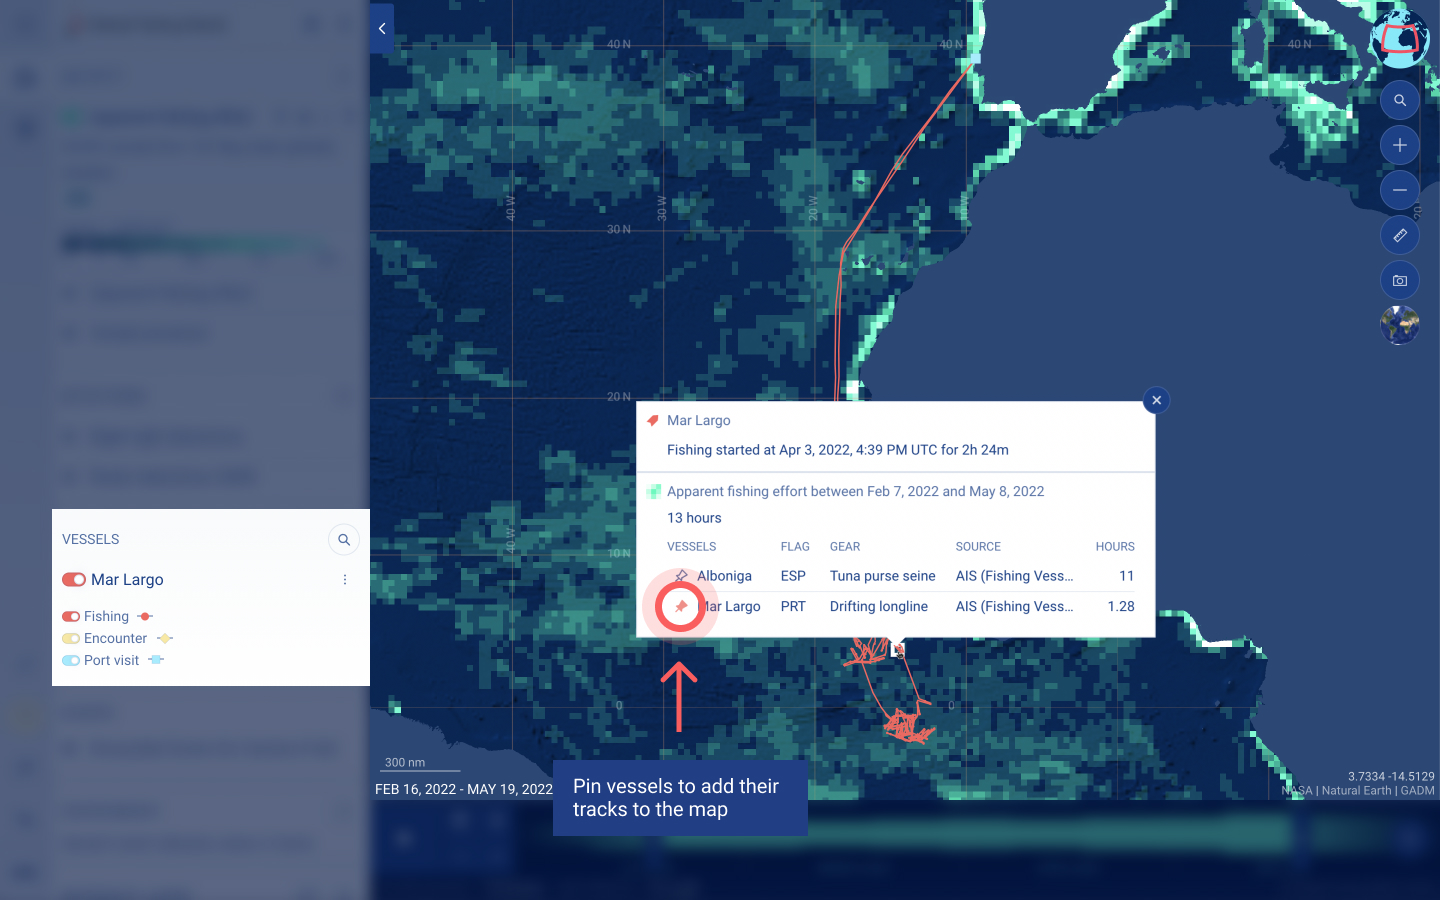
Click on the “See vessel” pin icon in the popup window to add the vessel to the left sidebar and see the vessel’s track on the map.
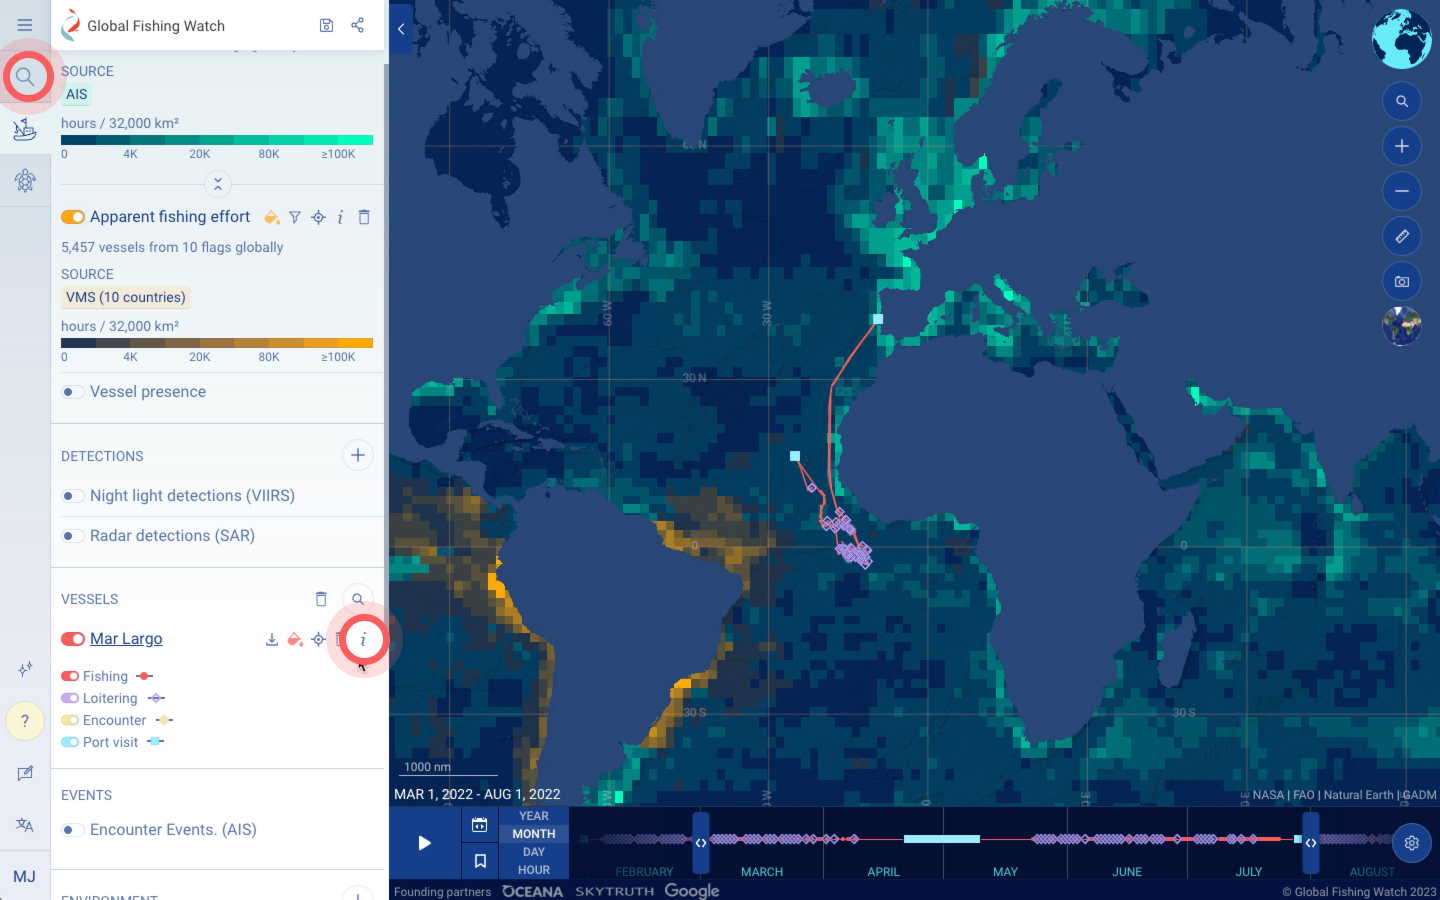
To learn more about the vessel’s identity, click on the information icon in the sidebar.
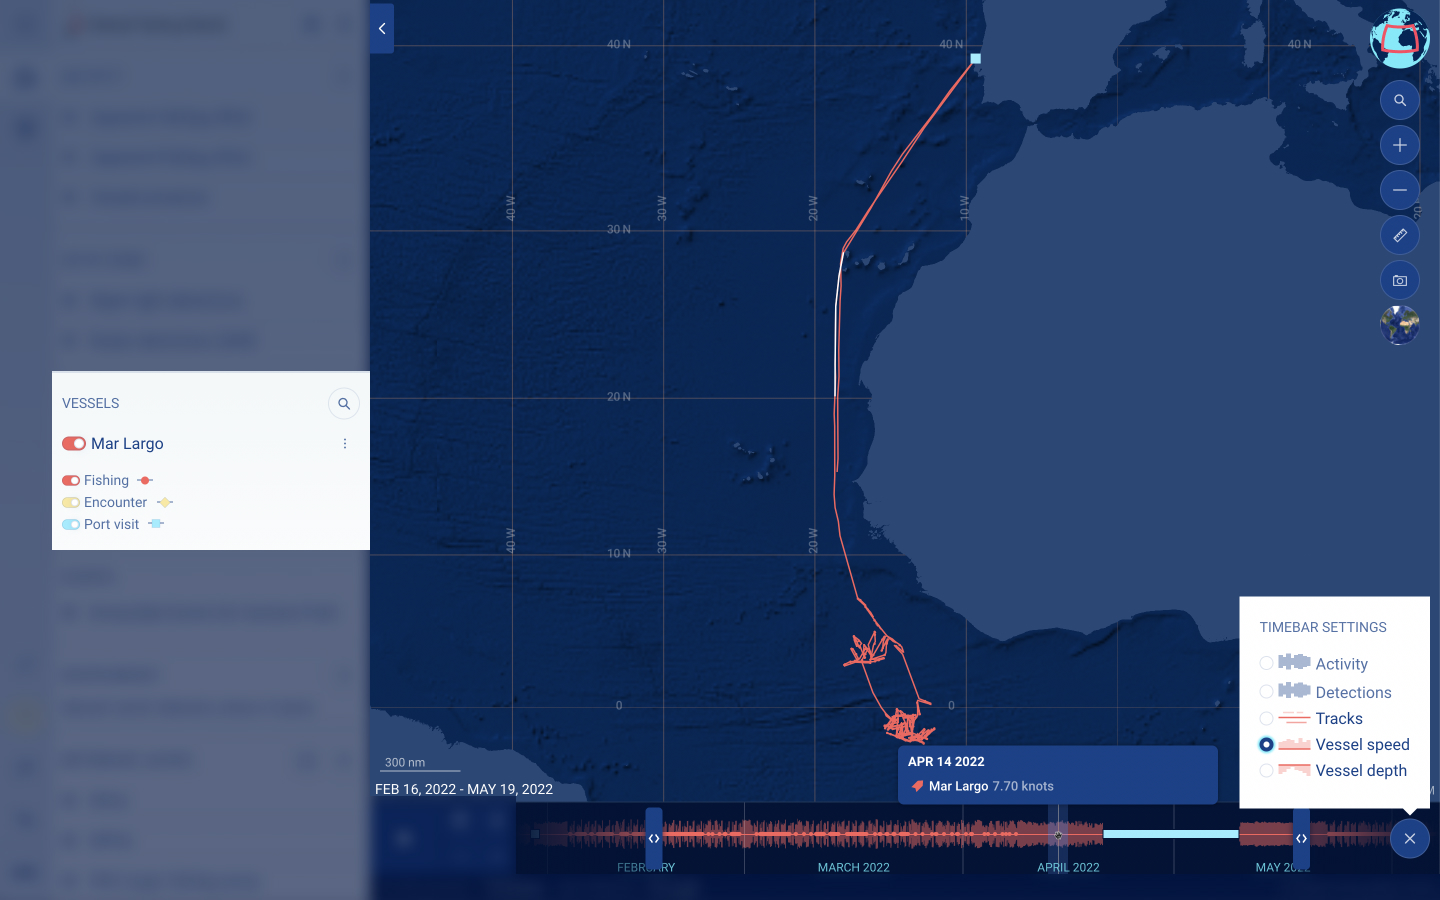
To understand the vessel speed and water depth below the vessel across time, you can go to the timebar settings.
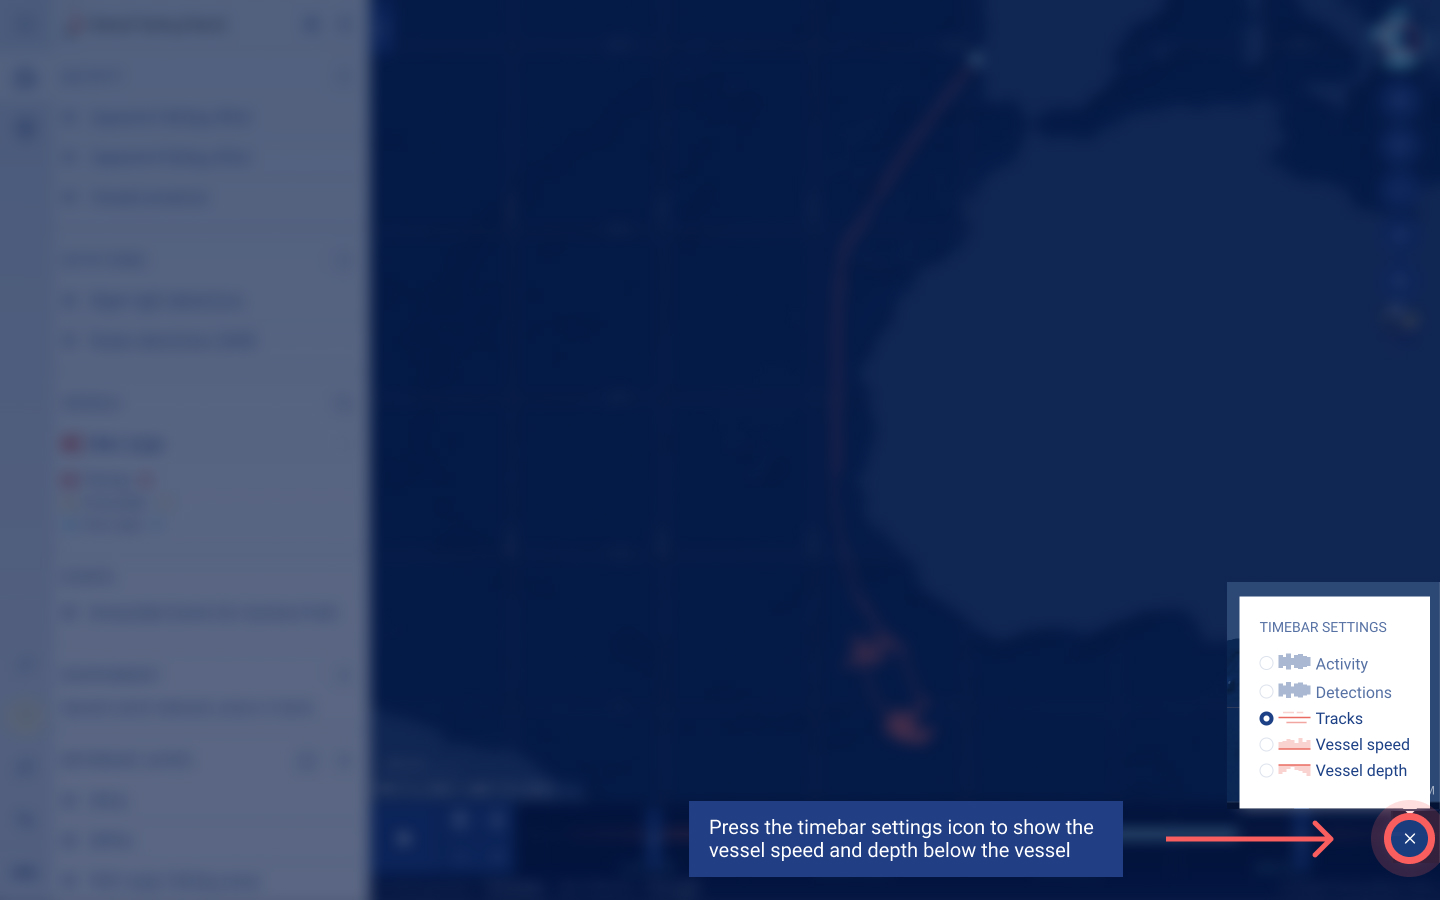
Hover over any point in the timebar to see the vessel’s speed or depth at a specific time.
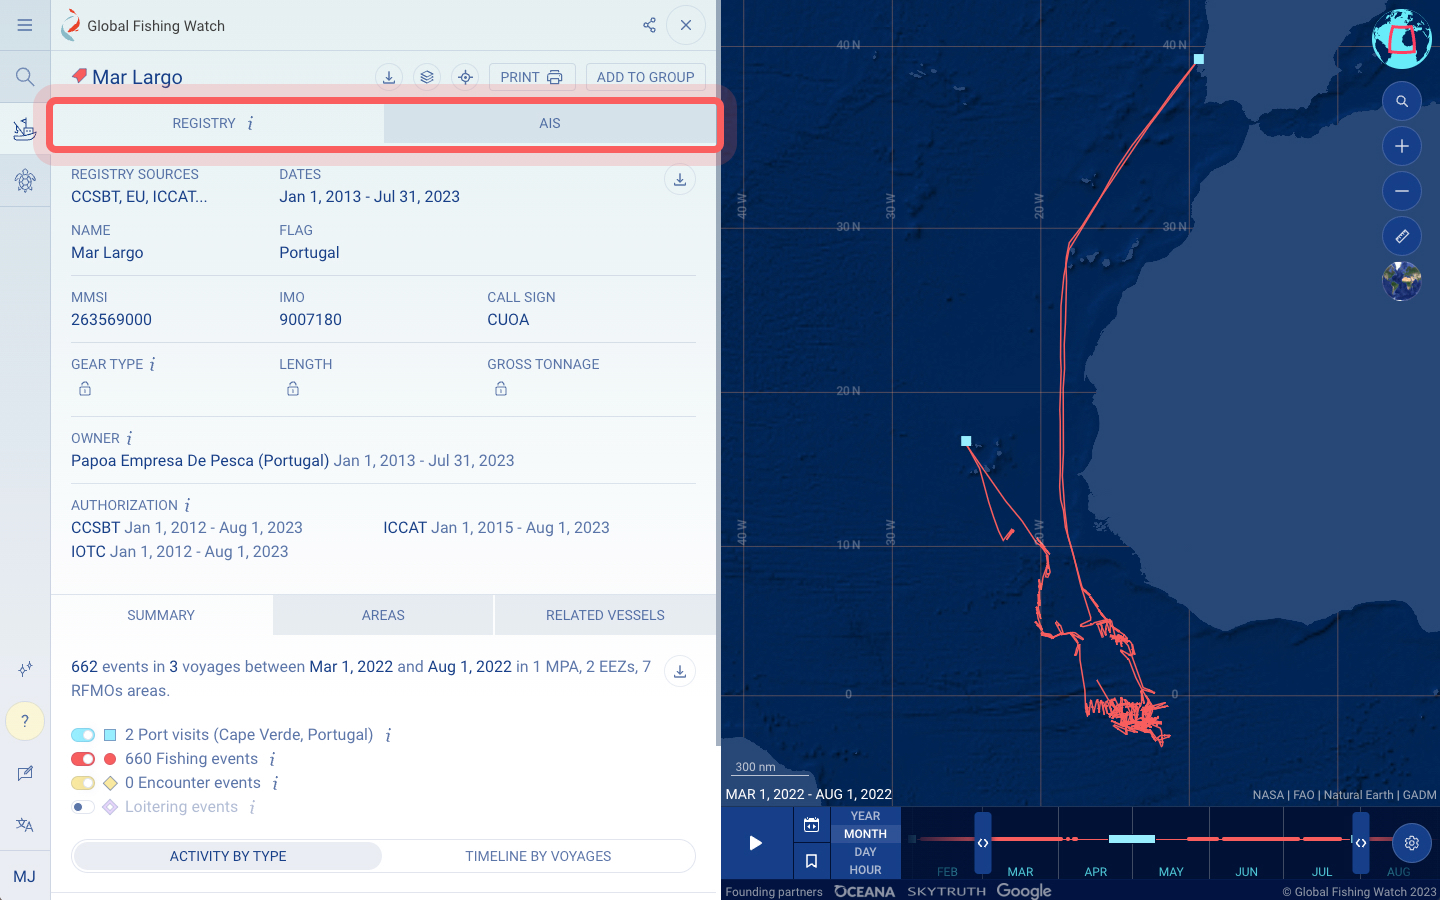
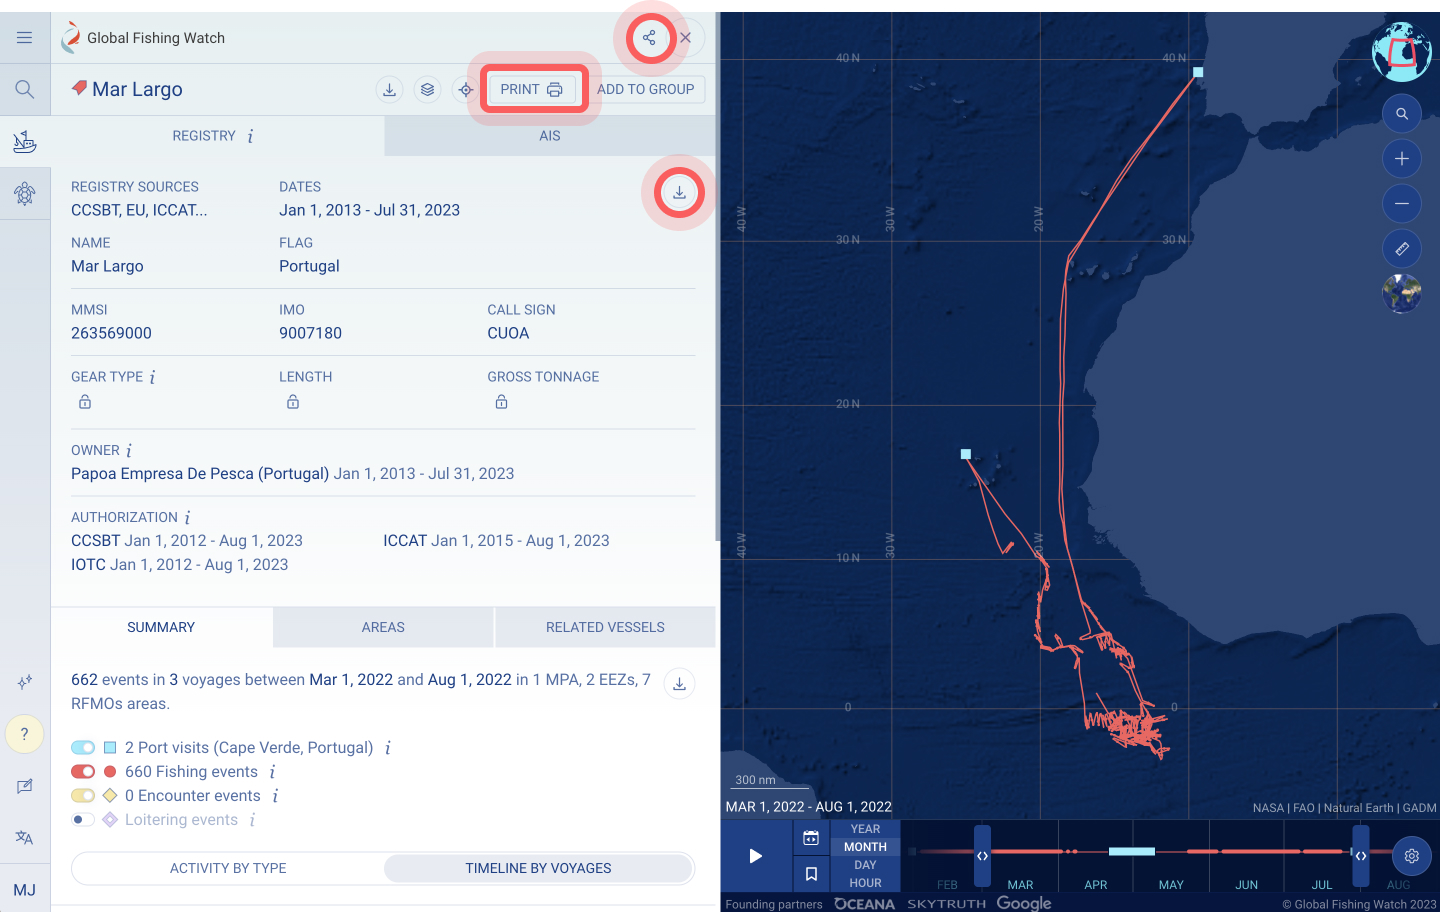
Vessel profiles provide an easy way to learn more about a vessel, including its identity information, activity and authorizations. Load a vessel profile through the vessel search or by clicking on the ‘i’ icon next to any vessel in the sidebar.
Where possible, Global Fishing Watch matches self-reported identity data received from AIS messages with information from over 40 publicly available vessel registry sources to corroborate identity information for any given vessel. You can compare identity information received from registries and through AIS by selecting either the REGISTRY or AIS tab.
Current identity information on a vessel may include its Vessel Name, Flag, Vessel Type, Gear Type, MMSI, Length, Tonnage, Owner, and Authorizations. To understand Global Fishing Watch’s definition and methodology for each data point, select the ‘i’ located to the right of each category heading.
Hover over and click on the dots under the identity information to explore multiple identities over time or discrepancies for a given vessel.
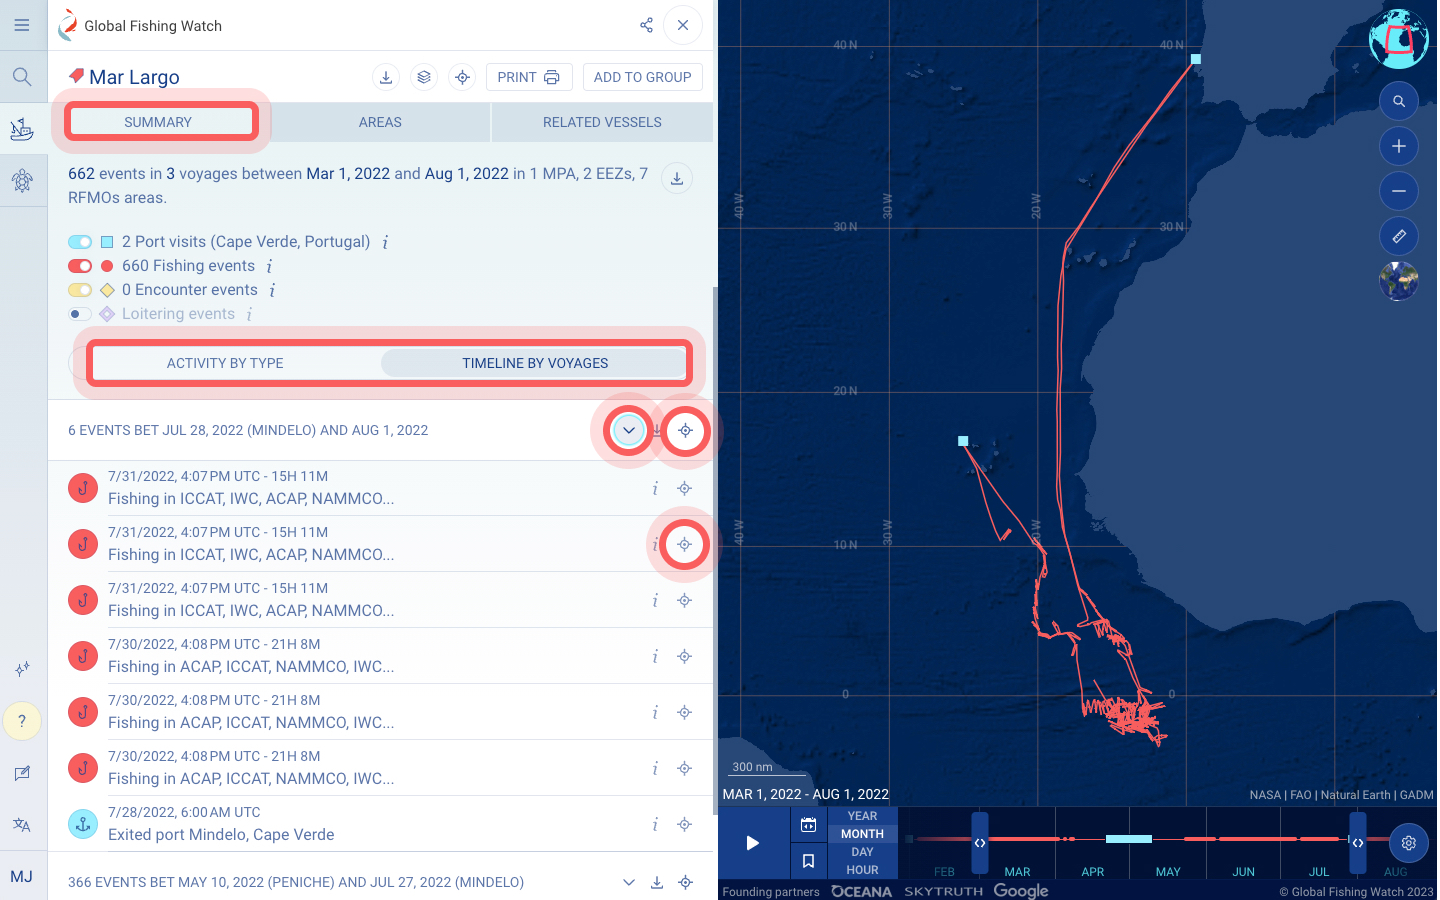
Scroll down to view the ACTIVITY tab and a timeline of the vessel’s activity, grouped by event type, which include:
- Apparent Fishing Events
- Encounters may indicate potential transshipment activity between two vessels that both appear in the AIS data source. Our algorithm estimates an encounter event when two vessels were within 500 meters for at least two hours, and traveling at a median speed less than two knots while at least 10 kilometers from a coastal anchorage.
- Loitering may indicate that a single vessel exhibits behavior indicative of a potential encounter event without having data for the other vessel, i.e. if it is not transmitting on AIS. Loitering is estimated using AIS data, including vessel speed and duration in a given location and distance from shore. Loitering occurs when a vessel travels at average speed of less than two knots while at least an average of 20 nautical miles from shore.
- Port visits are defined as a vessel that is:
- Within 3 kilometers from an anchorage point at the port entry and 4 kilometers from an anchorage point at the port exit, with a gap in AIS transmission of four hours or more,
- Or, at a port stop, which is measured as beginning with a speed of less than 0.2 knots that increases to a speed of over 0.5 knots
Events are estimated using machine learning and are based on the vessels’ apparent location and movement patterns. The summary of events represents the number of each event that occurred during your time range of interest. Change the time range using the timebar.
Group the events by voyage or event type. Voyage represents the period of time between two port visits, which can either both take place at the same port or different ports.
Toggle the events on and off to see where each event type occurred within the vessel track on the map and in the timebar. Click on any event within the vessel profile or map for more detail.
To center the map to any specific voyage or event, click on the compass icon.
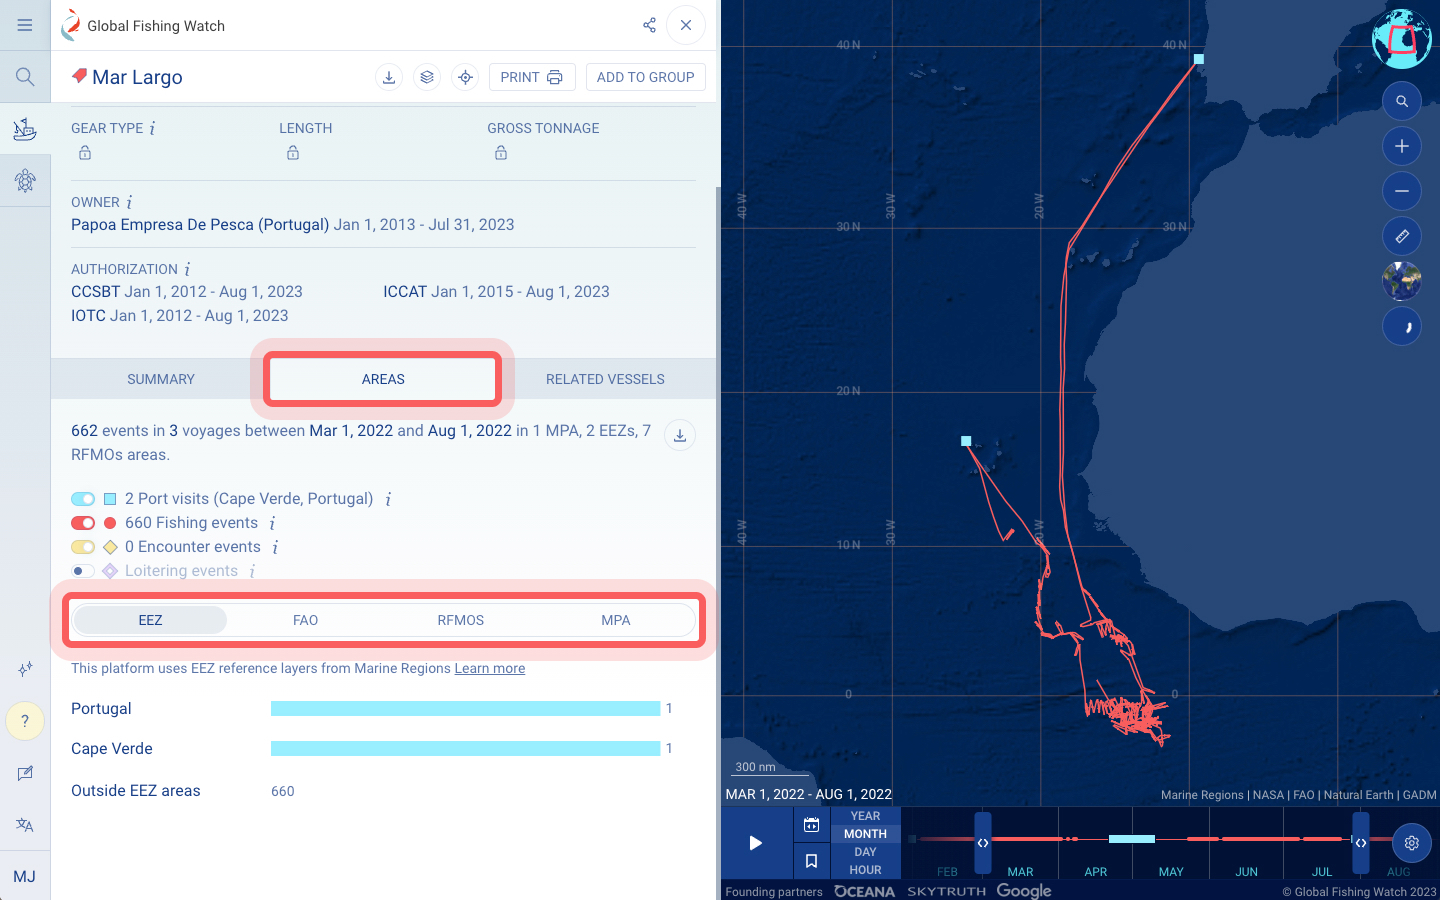
Select the AREAS tab to understand where the vessel’s events have occurred geographically. Toggle between EEZs, FAO regions, RFMOs, and MPAs from third-party sources to explore the distribution of events.
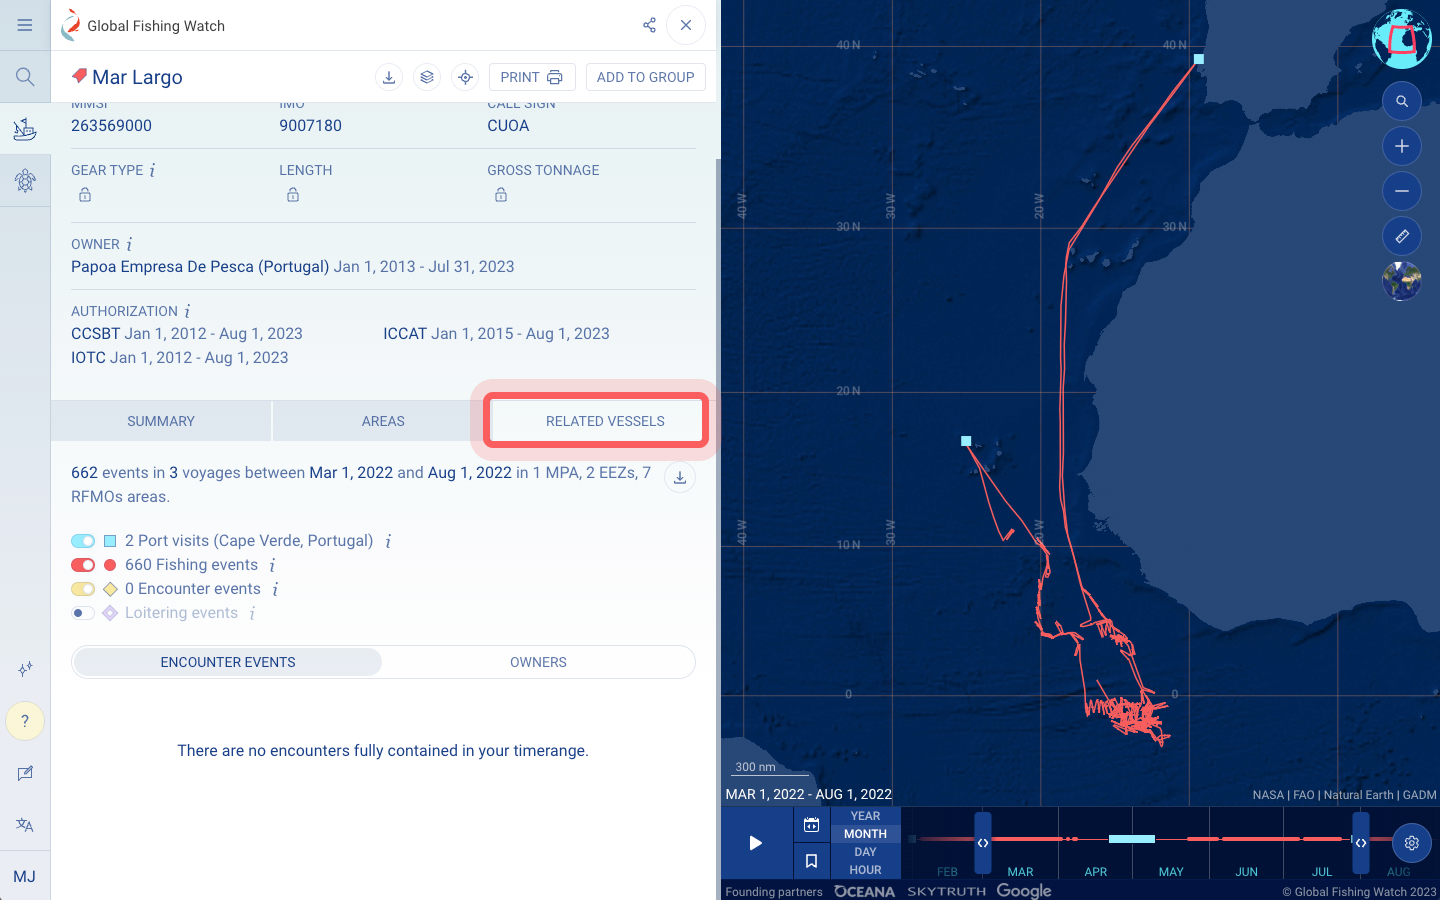
Select the Related Vessels tab to view vessels that may have interacted with this vessel via encounter events.
To access data from the vessel profile, you have several options:
- Download the identity information of the vessel as a CSV by selecting the download icon within the REGISTRY or AIS tab.
- Download the complete list of events as a CSV by selecting download icon located below the ACTIVITY tab.
- Download a subset of events by voyage as a CSV by selecting the download icon that is next to any specific voyage.
- Share the link to the vessel profile with anyone to access the same information by selecting the share icon at the top right hand corner of the vessel profile.
- Download the vessel profile as a PDF for offline access by clicking on the print icon at the top right hand corner of the vessel profile.
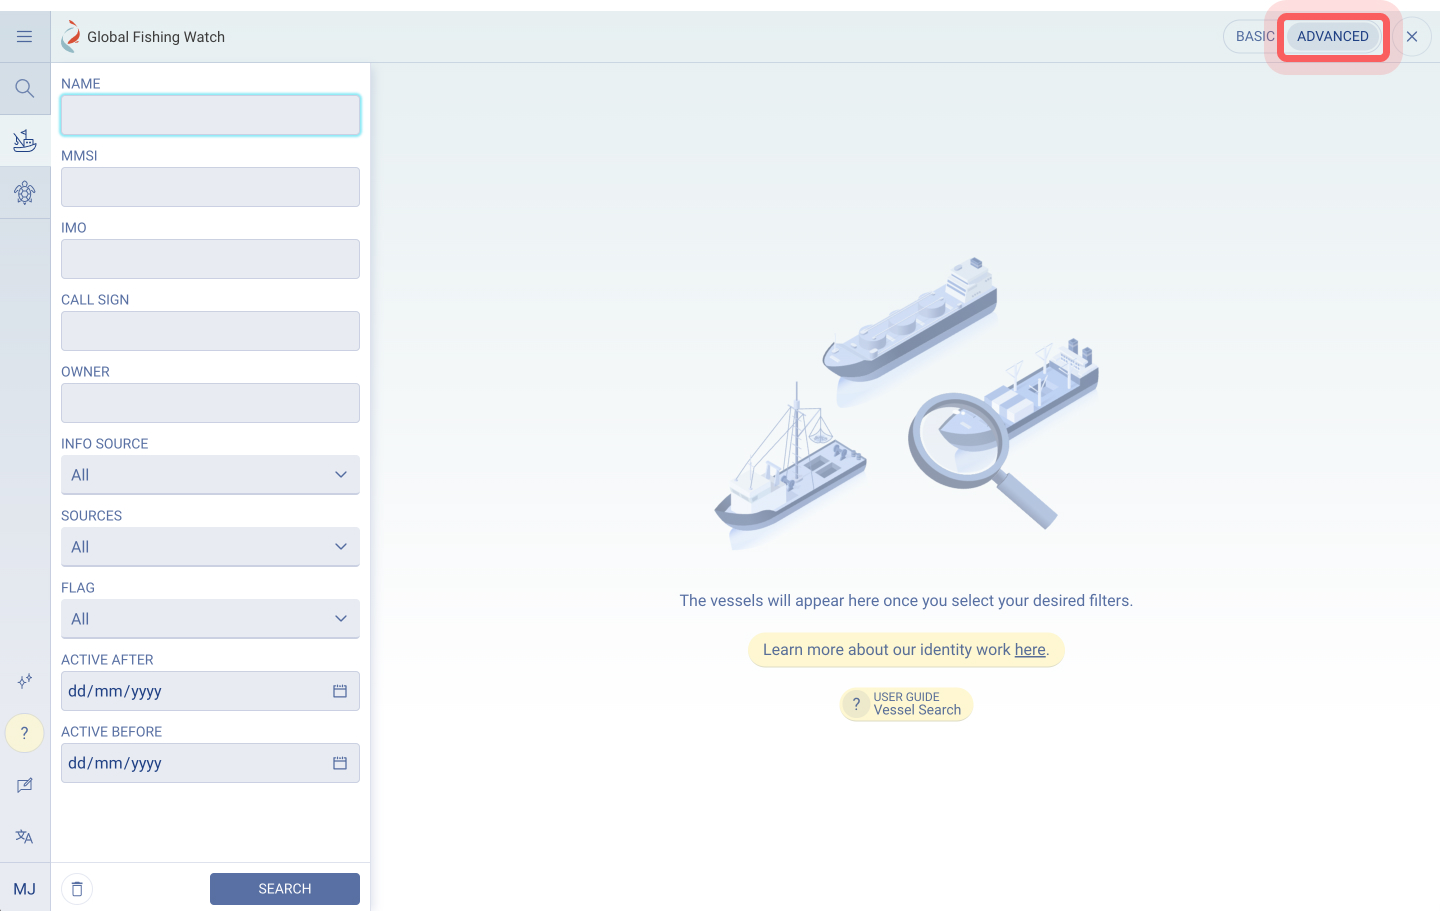
Search for individual vessels by clicking on the search icon in the top left corner or the map or search icon in the VESSELS section.
A window will open where you can perform basic or advanced vessel searches. To begin your search using the basic search, enter the vessel identification information (i.e., vessel name, MMSI number, IMO number or call sign) in the search bar. You can perform searches with as little as one identifier, however, using several identifiers improves the results. Note: To search for vessels from VMS sources, you will need to log in to your account.
Within the search results, view key information on the vessel’s identity as well as known transmission dates for the vessel, and the vessel’s approximate geographic position over time.
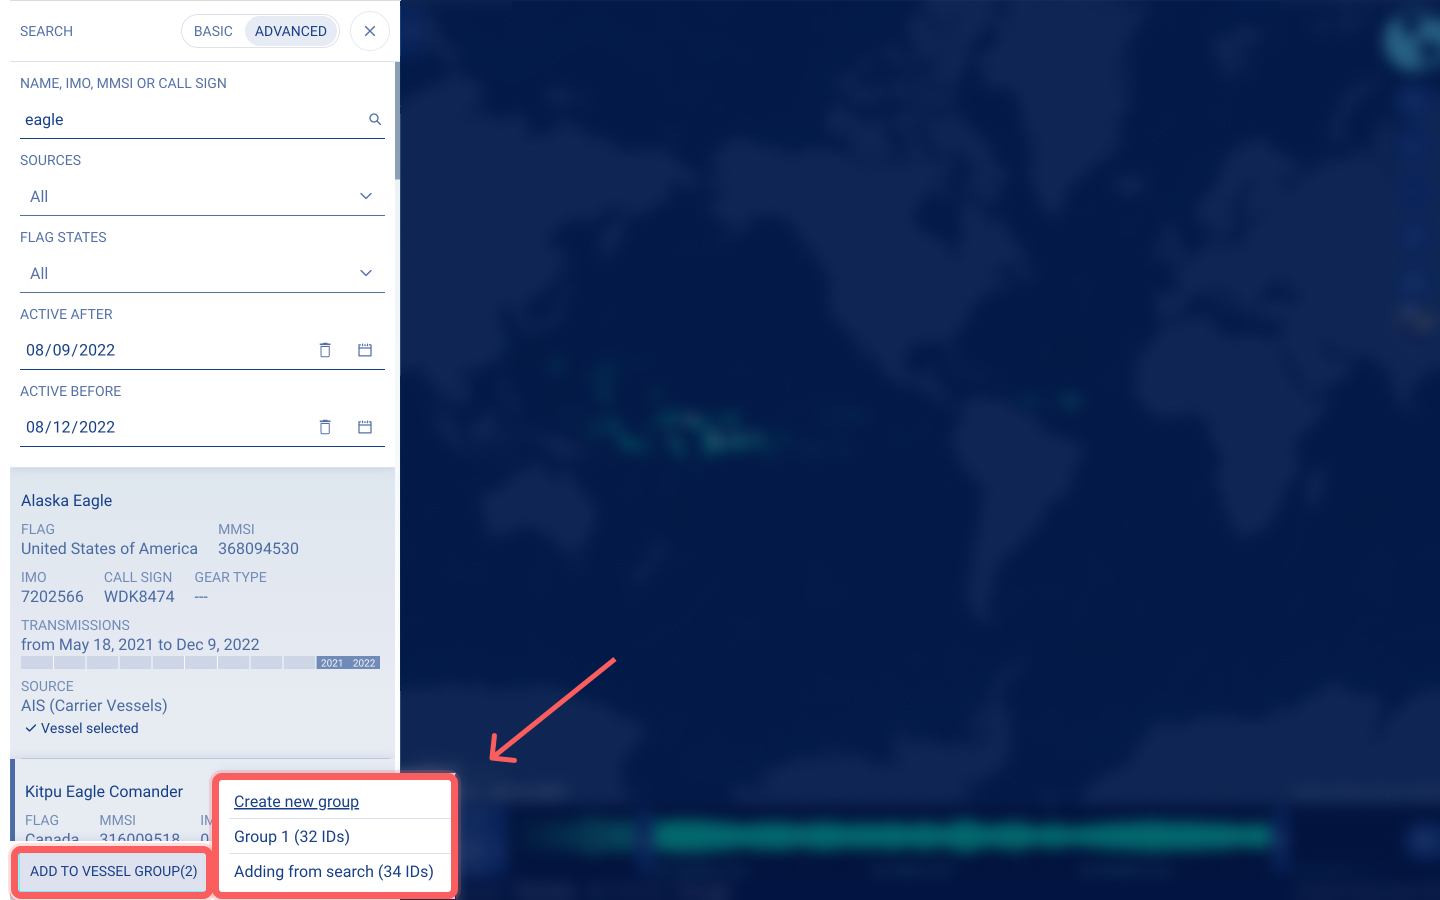
When several results are generated from a basic search and you would like to narrow down the results further, you can use the advanced search to specify the data source, flag and a defined time range.
- Search for “Eagle”
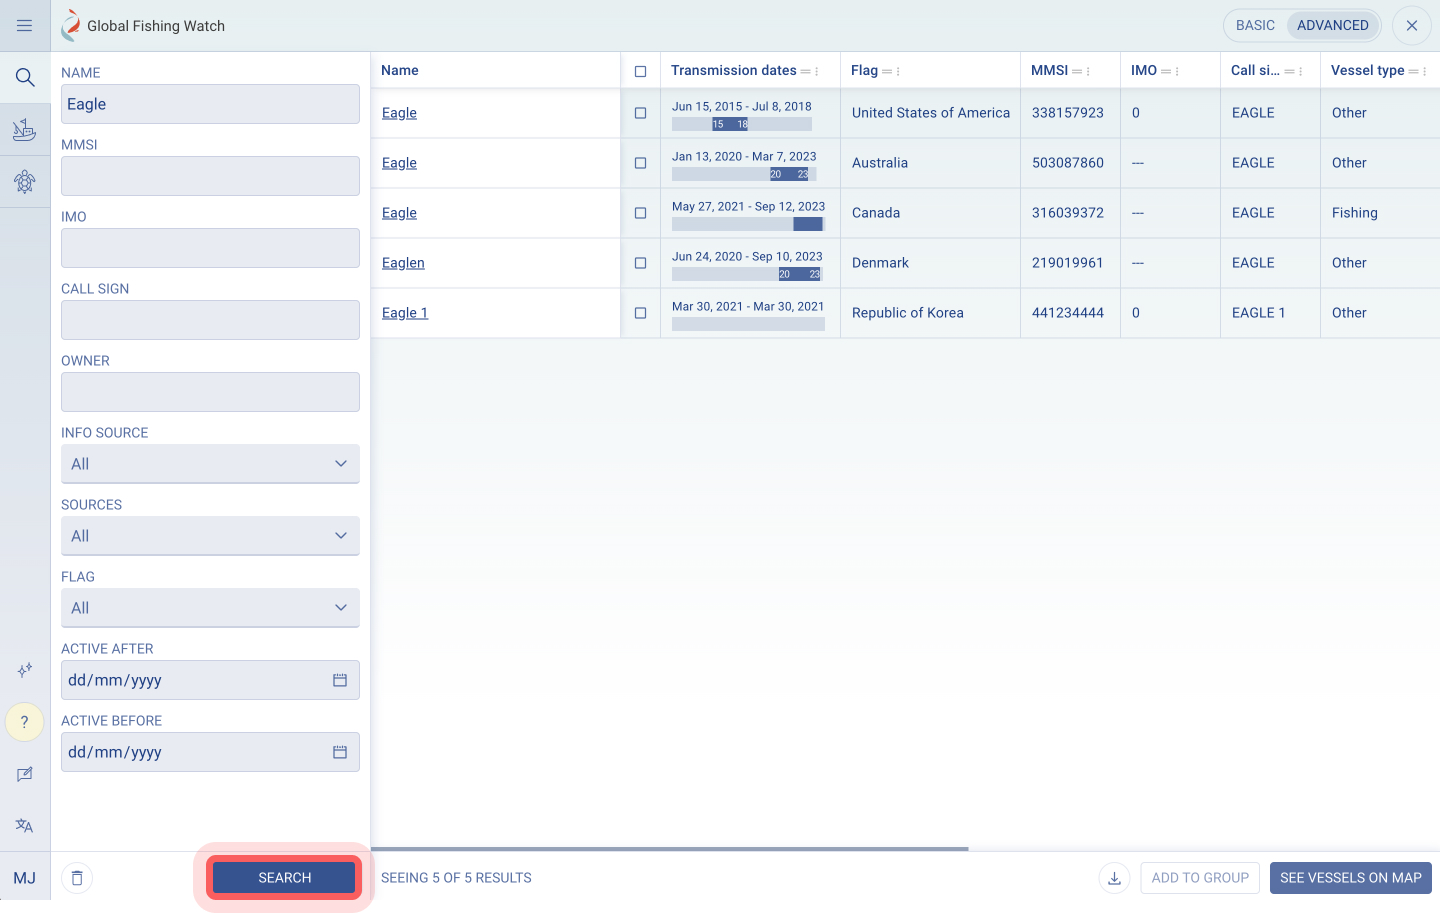
- Select a vessel from the results. Often there are multiple vessels with the same name, so you may need additional information to find the correct vessel. There are a few reasons why one vessel can have multiple results, including:
- Global Fishing Watch analyzes the geographical positions of vessels using AIS messages. There are, broadly speaking, two types of messages: identity and positional messages. Identity messages don’t have positional data, while positional messages only relay the MMSI. This means that the system must automatically consolidate both types of messages, generating several results for the same vessel over different time periods.
- In this example, the MMSI is different between the first and second result.
- In this case, we are looking for MMSI 503608400. Select the vessel and click on “See vessel on map.” (Note: you can select more than one vessel at a time.)
- Click on the compass icon to center the map on the vessel track during your selected time range. If all vessel activity happened outside of your time range, a popup will prompt you to change the time range.
- To change the color of a vessel track, click on the paint icon.
- To view vessel details, click the information icon.
- Remove the vessel from the map by clicking on the delete icon.
Learn more by watching this tutorial on searching for vessels and animating vessel tracks.
To understand where groups of vessels are active over space and time you can create custom vessel groups. A vessel group can be defined by your own parameters and may include a set of vessels present in an area, a group associated with a certain supply chain entity, or a fleet associated with a company.
You can create a new vessel group by following these steps:
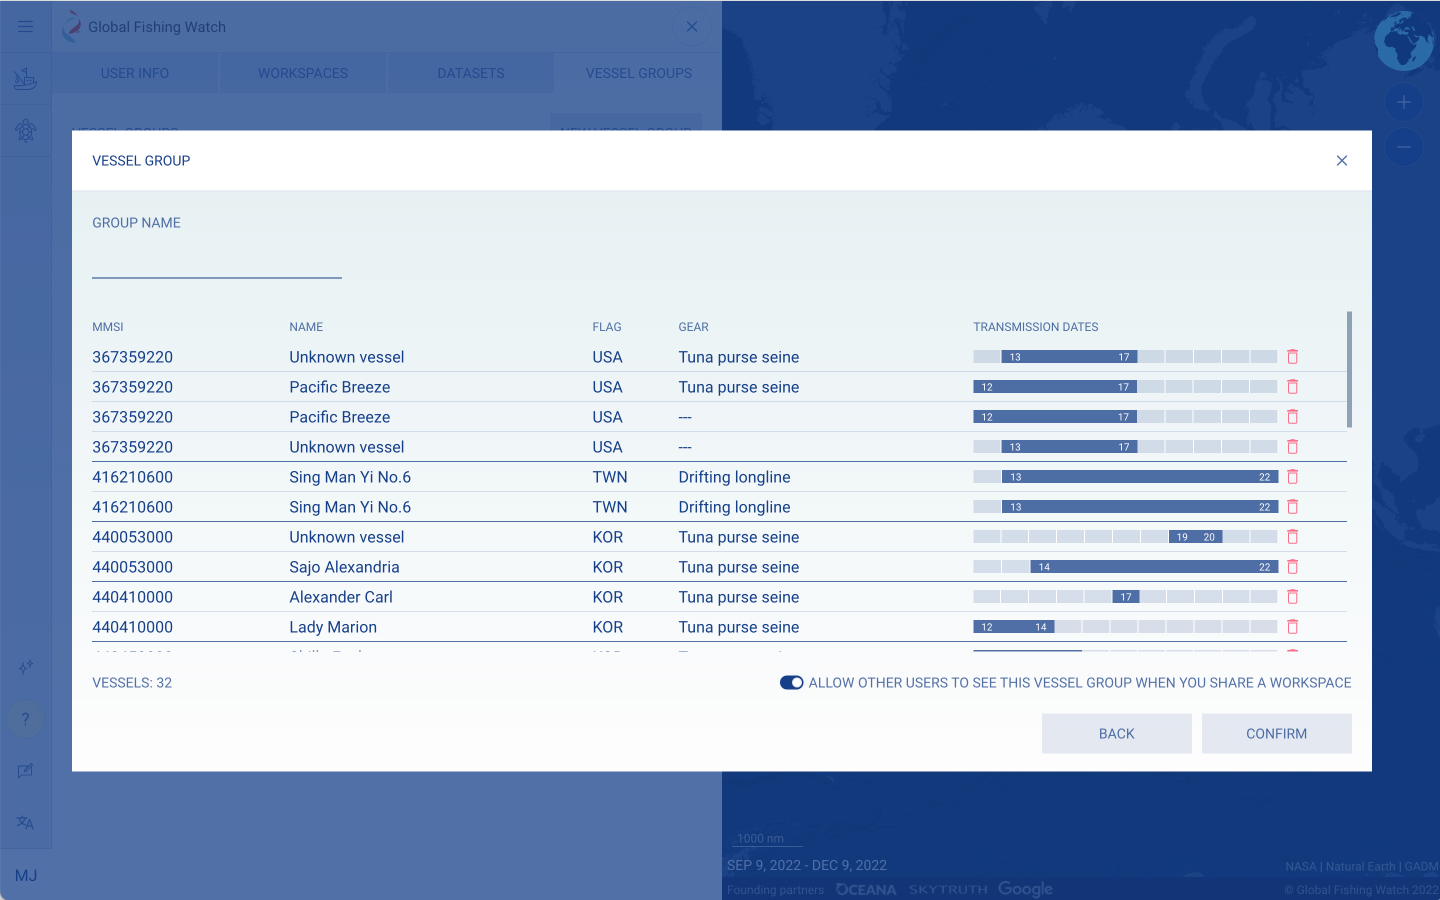
- Select ‘New vessel group’ from the VESSEL GROUPS tab in your user profile
- Paste a list of MMSIs in the field or upload a spreadsheet or CSV file to populate your group with a list of vessels
- Add a group name for the new vessel group
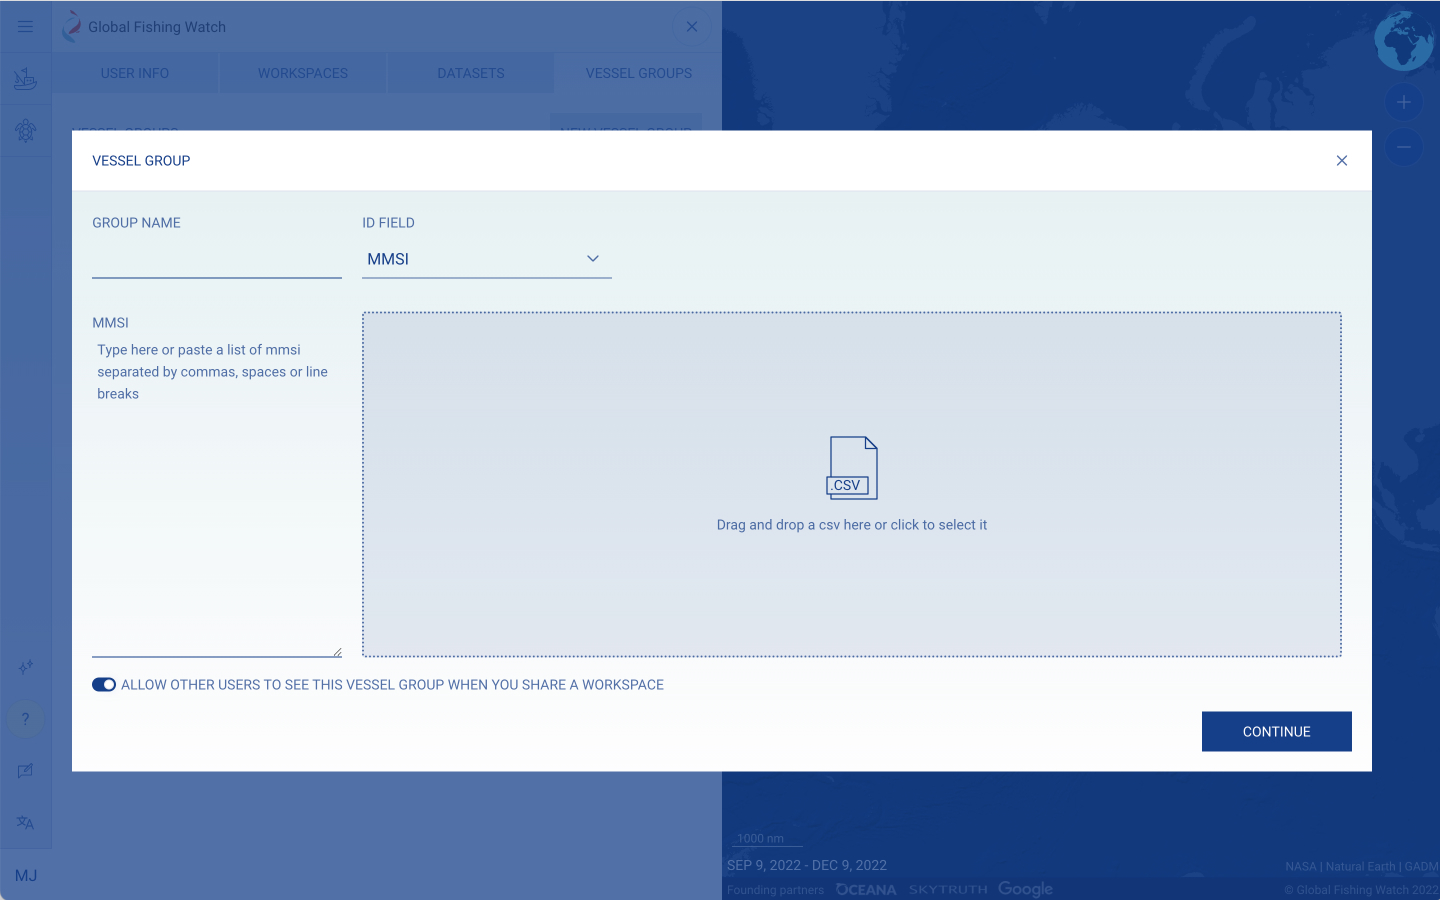
- You will be able to see vessels within Global Fishing Watch’s dataset that match the MMSIs you entered or uploaded and can remove vessels that you don’t want included in the vessel group
You may also add vessels from the basic or advanced vessel search to a new or existing vessel group to create a group. If new, add a group name.
You can choose if you would like to allow other users to see this vessel group if you share a workspace that contains the uploaded data, or keep it private.
To add a vessel group to your map, filter an activity layer by the vessel group. For performance reasons, there is a limit on maximum time range by which to view vessel group activity.
Learn more by watching this tutorial on vessel groups.
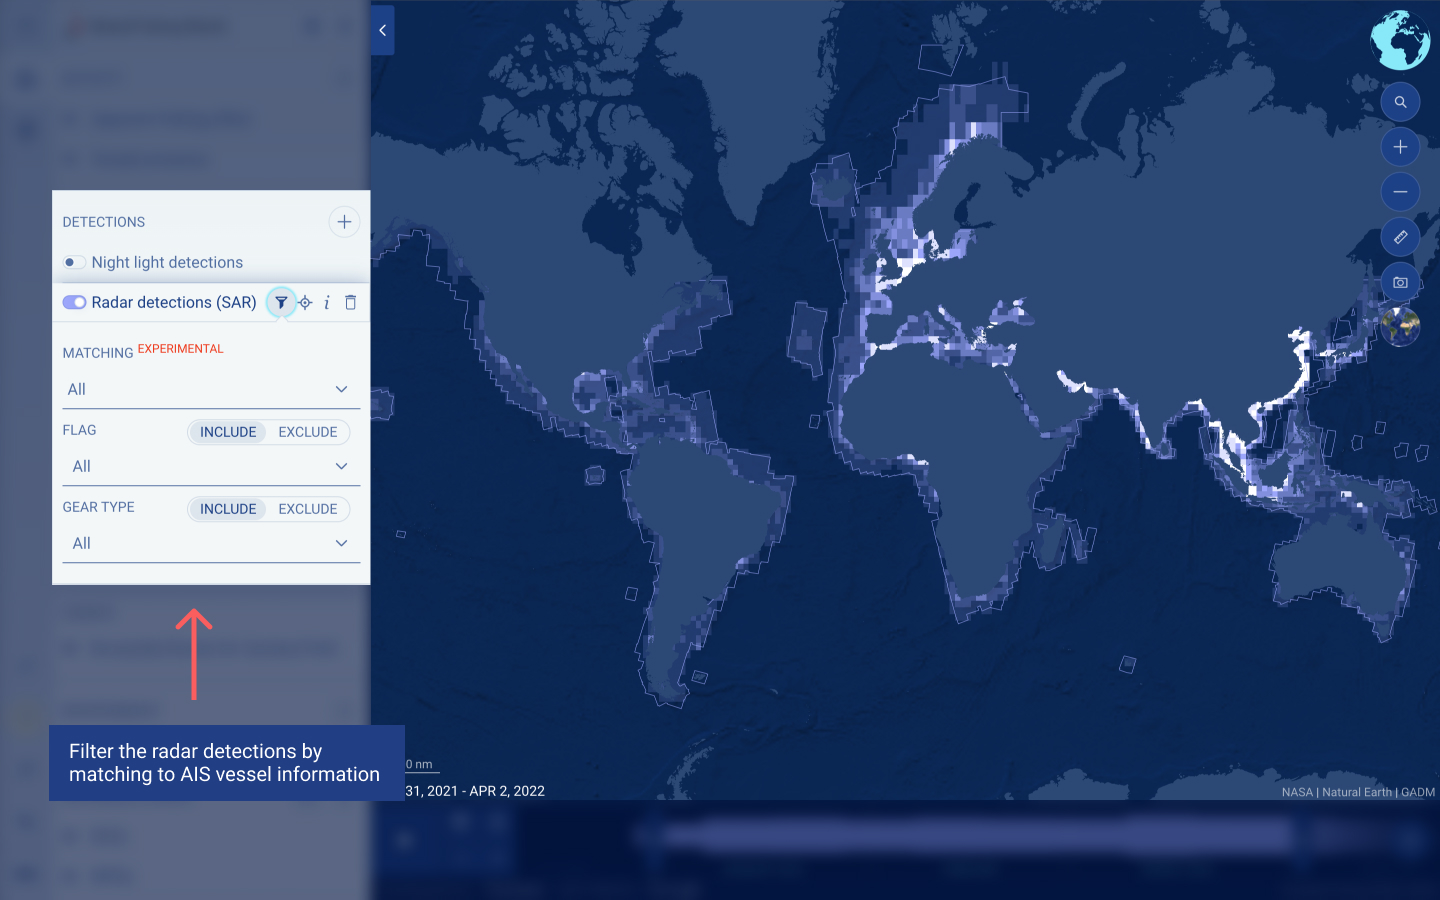
We use SAR imagery from the Copernicus Sentinel-1 mission of the European Space Agency, which is sourced from polar-orbiting satellites (S1A and, formerly, S1B), to detect all vessels on each scene. Our approach combines a modified version of a well established ship detection method (constant false alarm rate) with modern machine learning to identify the size of detections and eliminate false detections. This detection approach consists of identifying the pixels with a “brightness” level above the mean backscatter of the background, representing the sea clutter around the target, and then using machine learning to filter and improve the results.
The Visible Infrared Imaging Radiometer Suite (VIIRS) satellite sensor can identify bright lights at night. In the dark ocean, vessels using bright lights stand out to this sensor and can be tracked. Some forms of fishing, such as squid jigging and some purse seines, use bright lights at night and squid fleets can be easily seen in the VIIRS data. The night light vessel detections activity layer on the map is a heatmap of likely vessels–both fishing and otherwise–detected by VIIRS.
A few caveats are necessary for understanding these detections though:
- Not all ships detected are actually fishing vessels – some may be other large vessels
- Many vessels fish without lights, or with dim lights, and would not show up in this dataset
- There can be “false positives” – places where the algorithm detects a light, but which result from errors or noise
- In rare cases, the algorithm may pick up airplanes on international flights
Nonetheless, the night light detections (VIIRS) data shows some clear fishing patterns that are not visible in other Global Fishing Watch data layers, helping to illuminate human activity around the ocean.
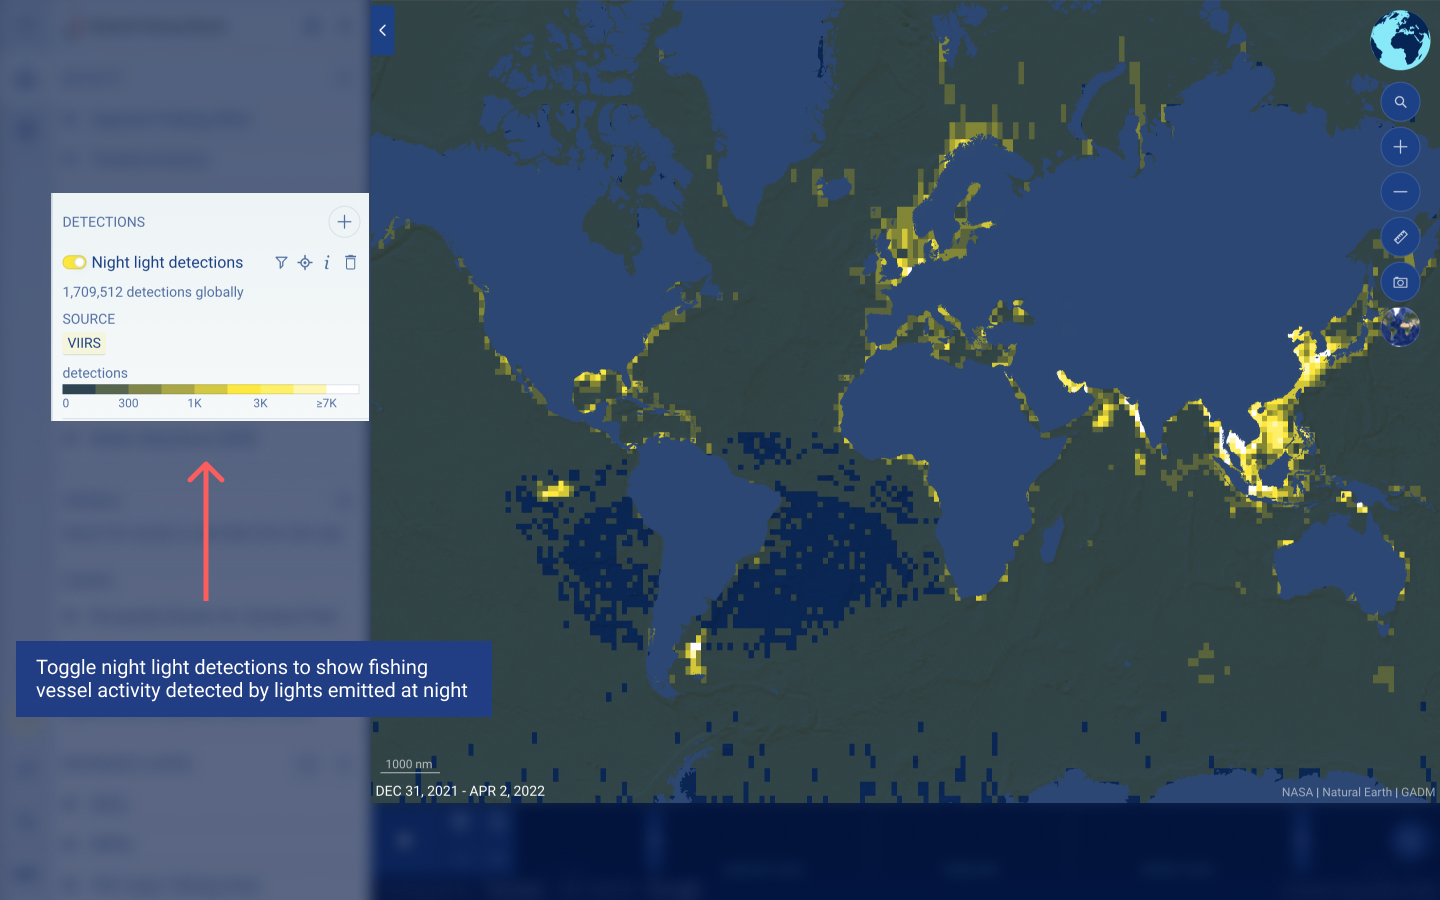
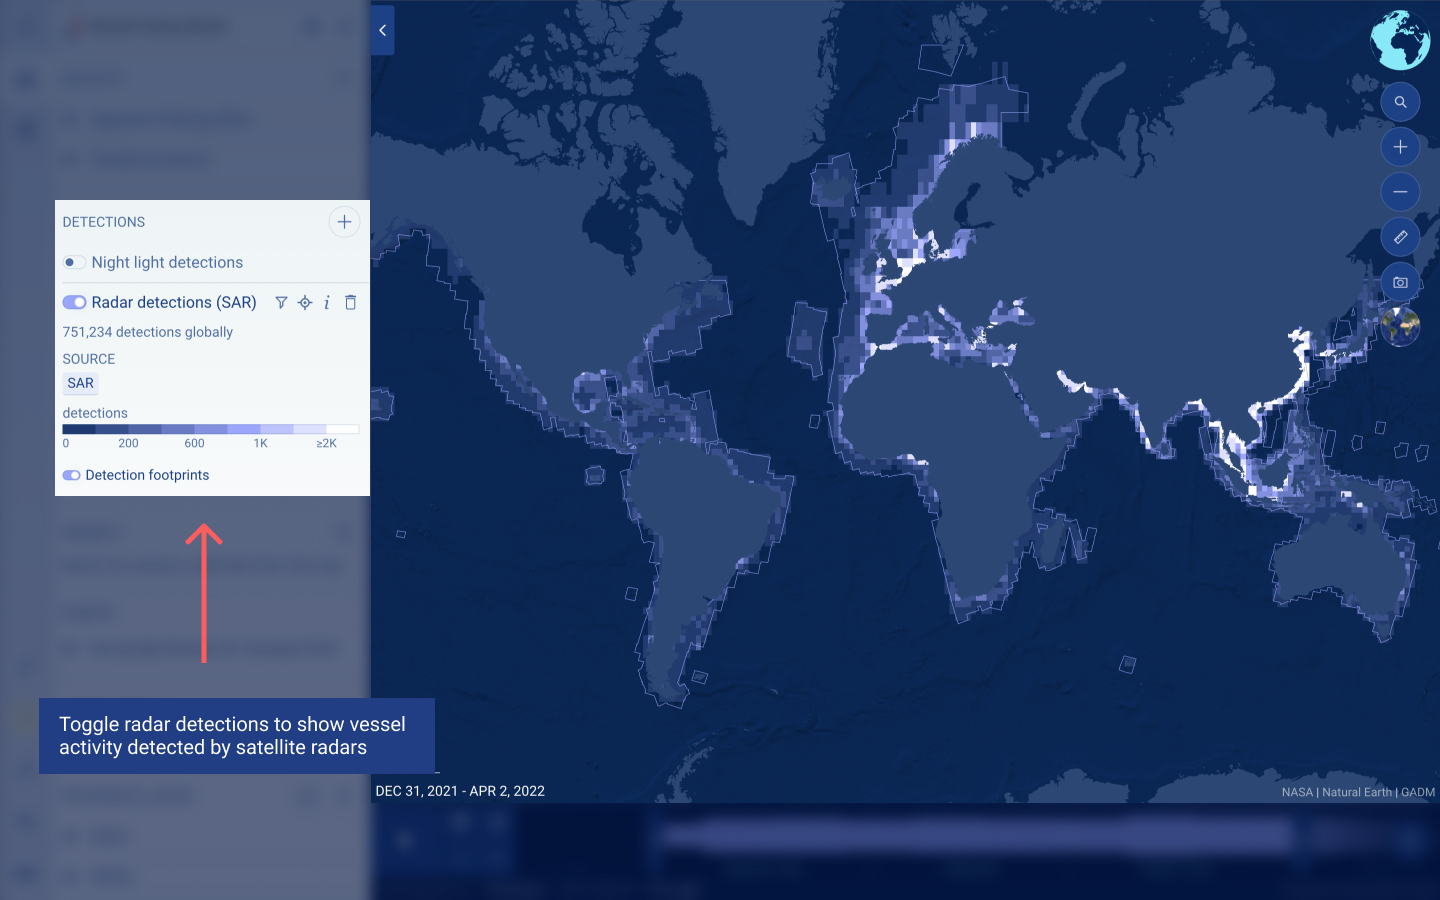
- On the left sidebar, underneath the ACTIVITY section is the DETECTIONS section . Toggle on the Night light detections (VIIRS) or Radar detections (SAR) layer.
- Select the time range and region that you would like to explore.
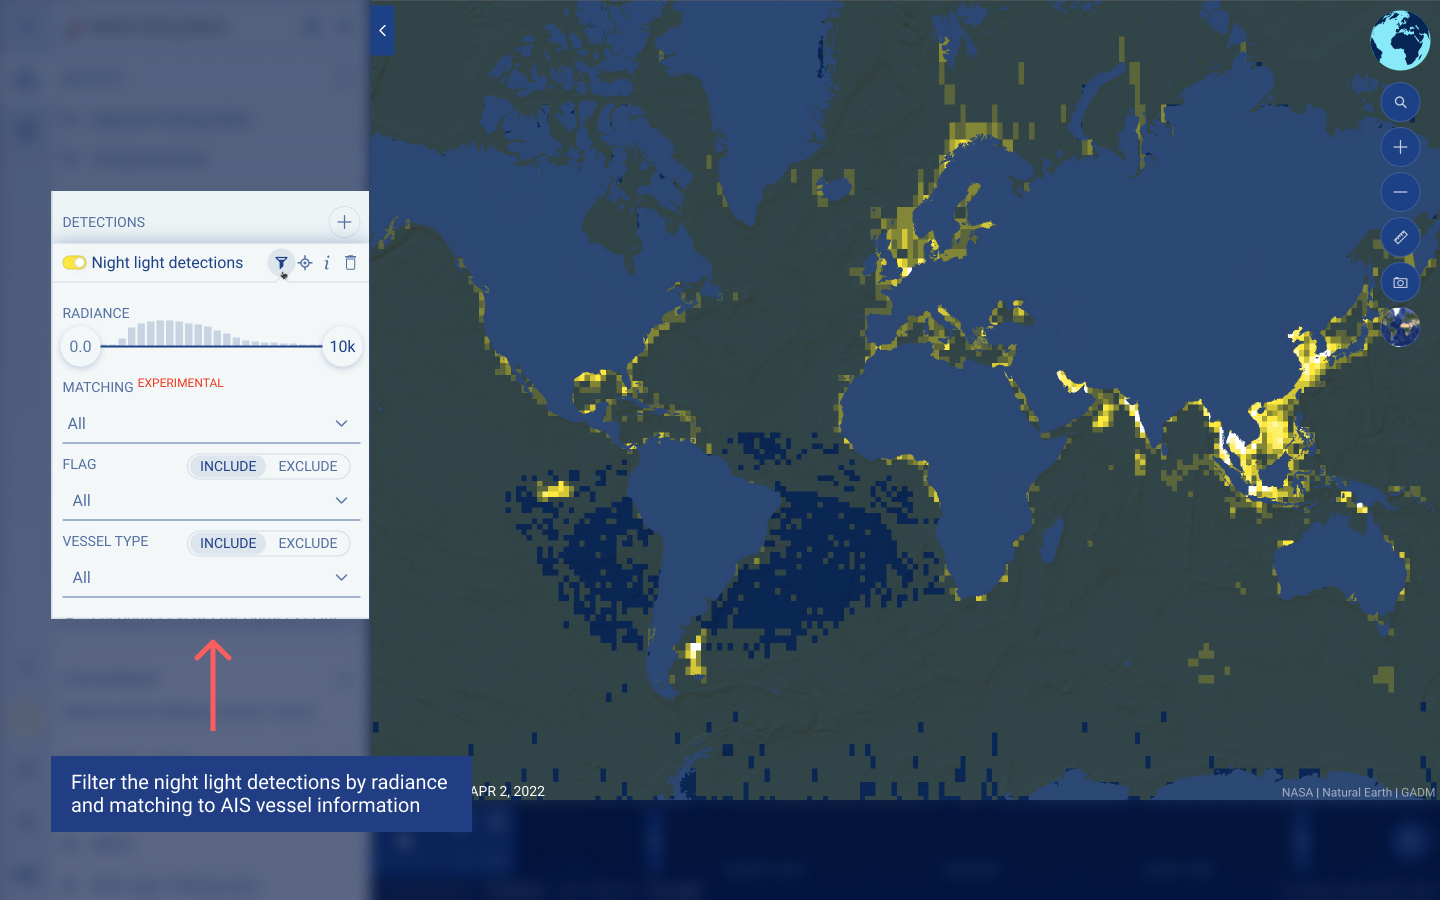
- Click on the filter icon to filter the data. For both layers, there is an experimental filter that matches both datasets to available AIS data for vessels. To see the matched vessels, select “True” under the matching filter.
- With the AIS-matched data, you can filter by flag and gear type within the SAR layer, and you can filter by flag and vessel type within the VIIRS layer.
- On the left sidebar, underneath the VESSELS section is the EVENTS section. Toggle on the Encounter Events for Carriers-Fishing Vessels (AIS) layer.
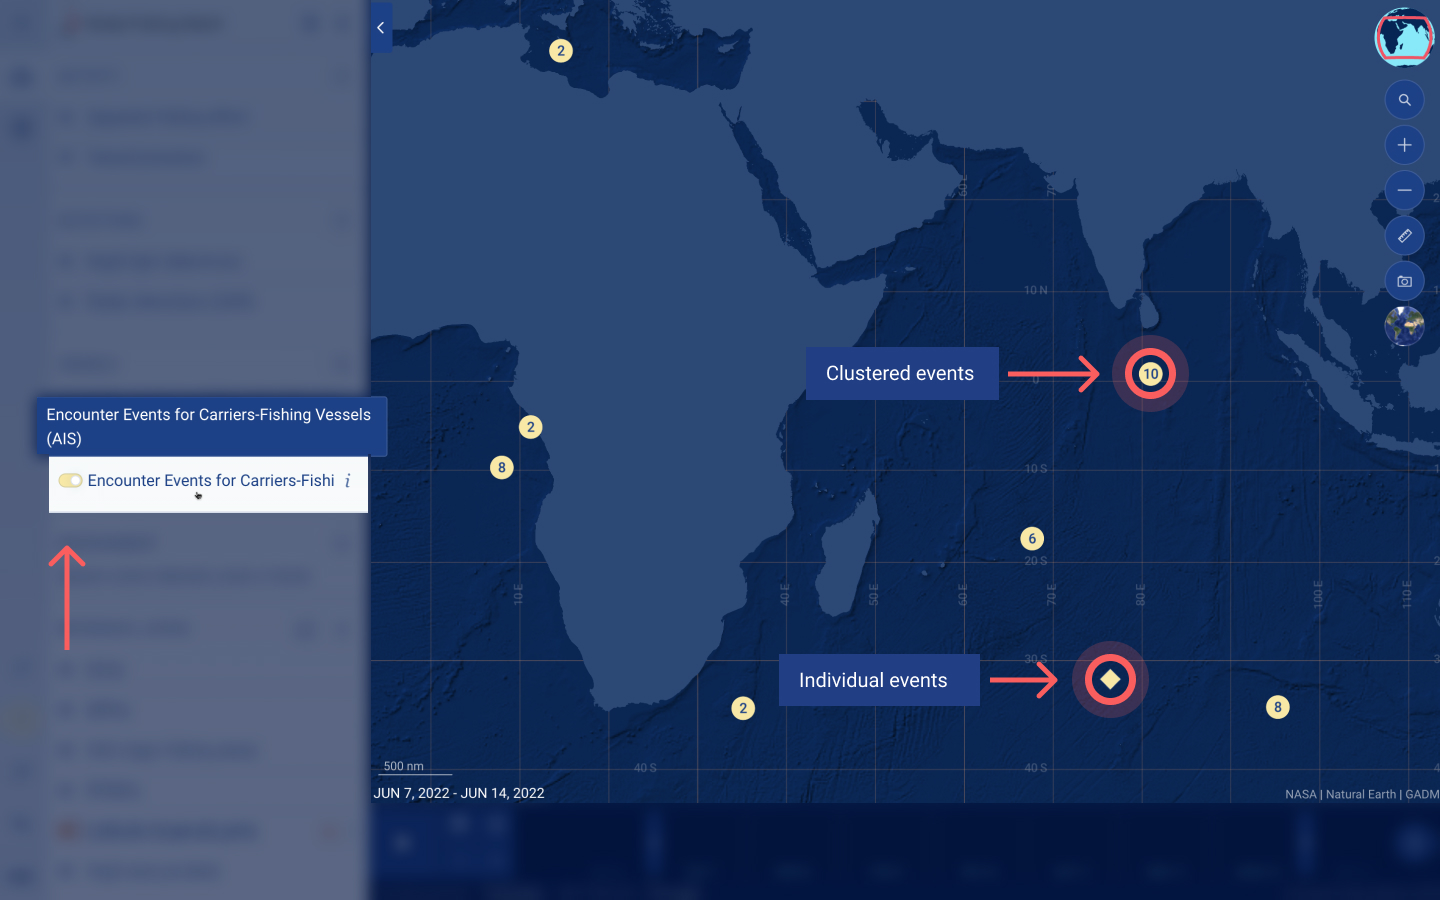
- Select the time range from June 7, 2022 to June 14, 2022.
- Zoom into Madagascar.
- Click on an encounter that is south of Madagascar.
- Selecting the encounter will provide basic identity information about the carrier and fishing vessel, as well as information about the encounter that occurred. A link will also be provided to our carrier vessel portal (if available).
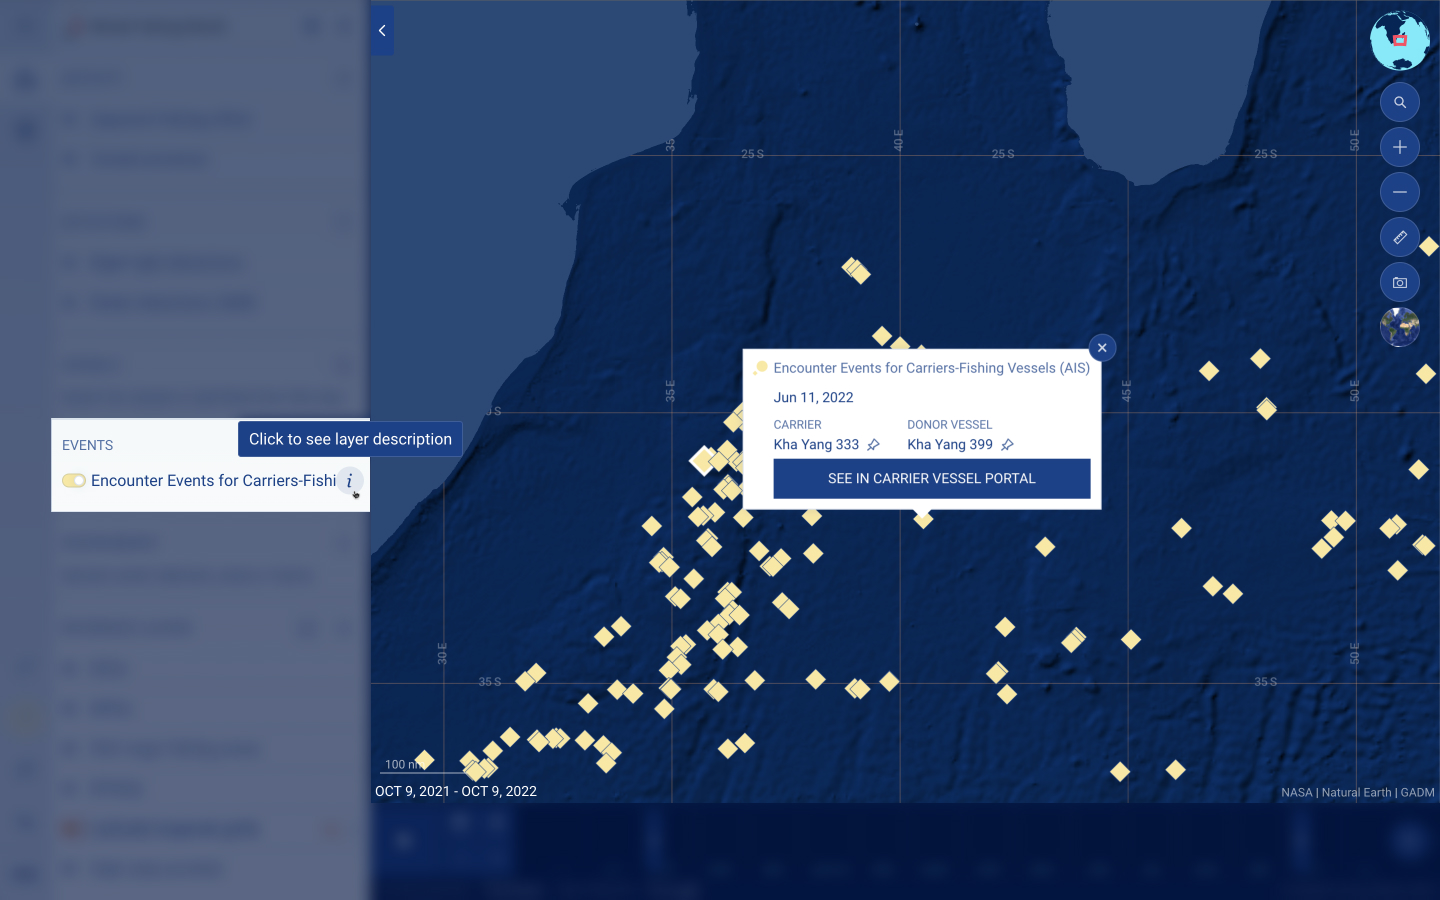
- To see the trajectories of the carrier and fishing vessel involved, you must include both vessels in the left panel by clicking on the pin track icon.
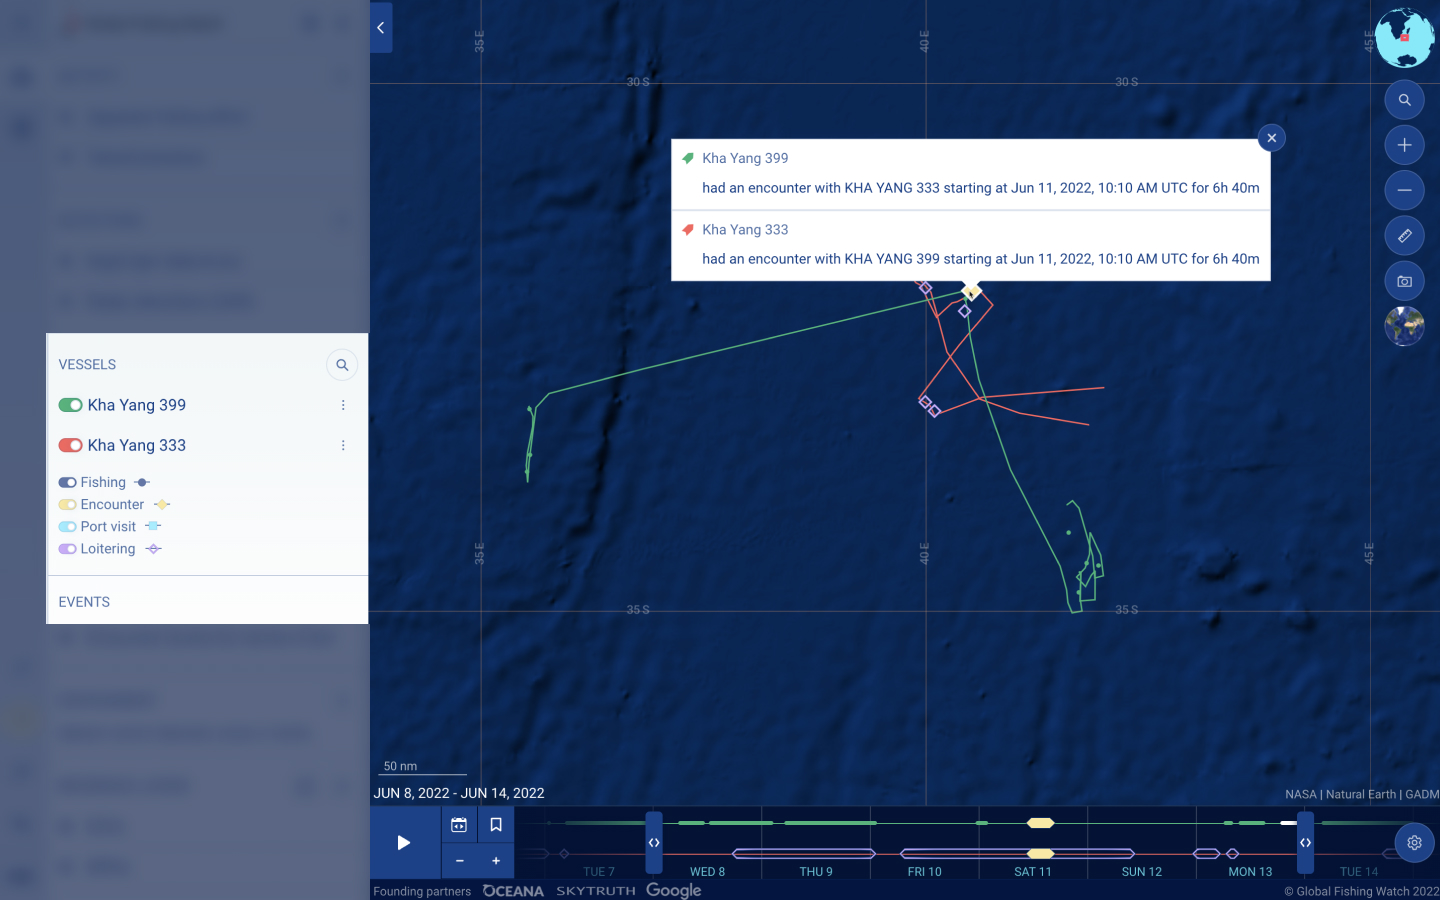
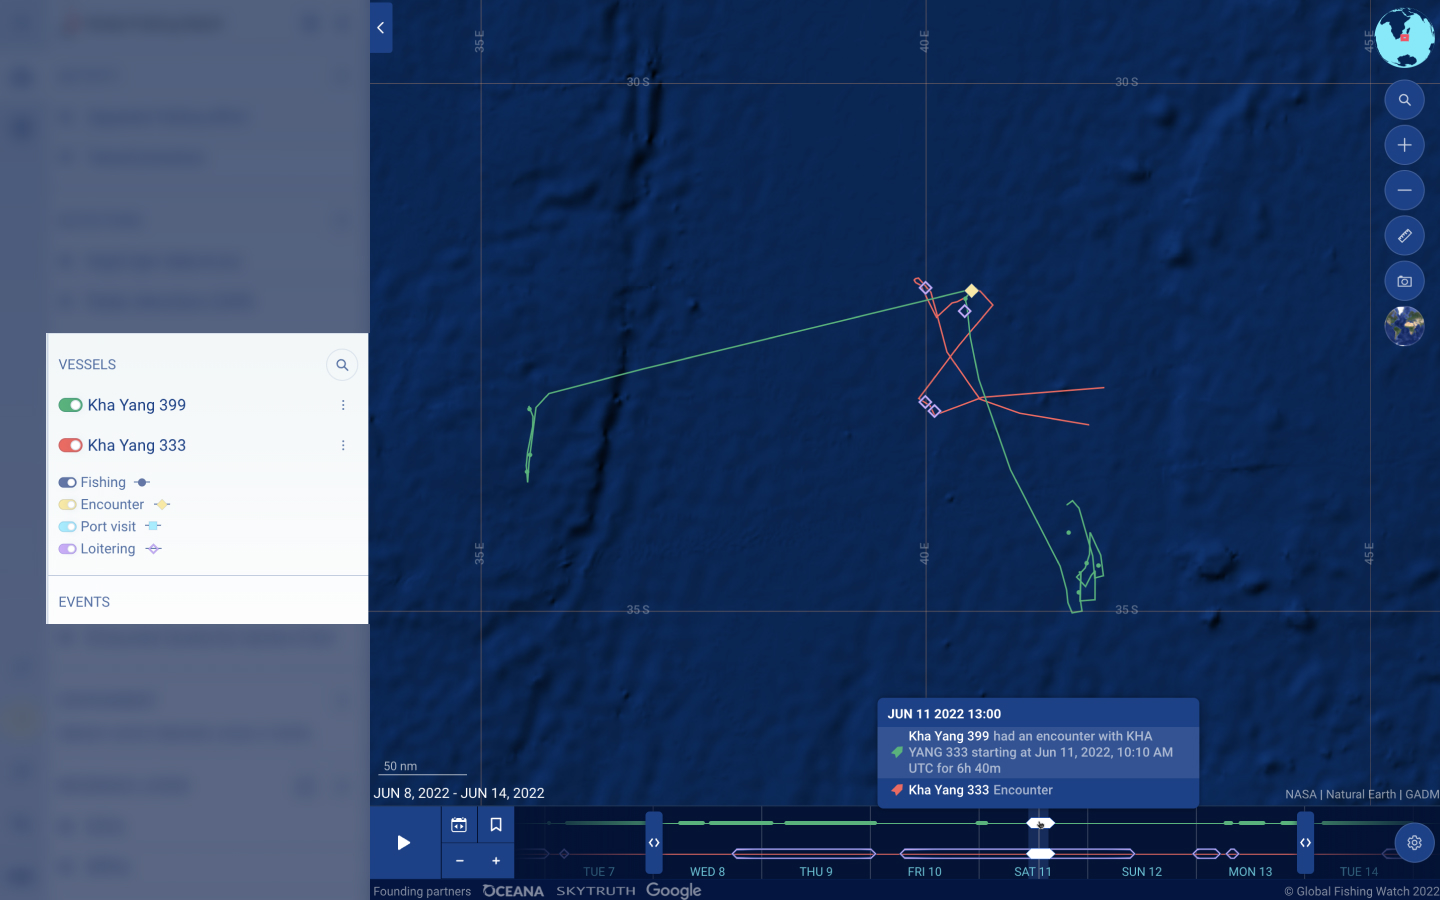
- Press play to see how the tracks of the vessels changed over time.
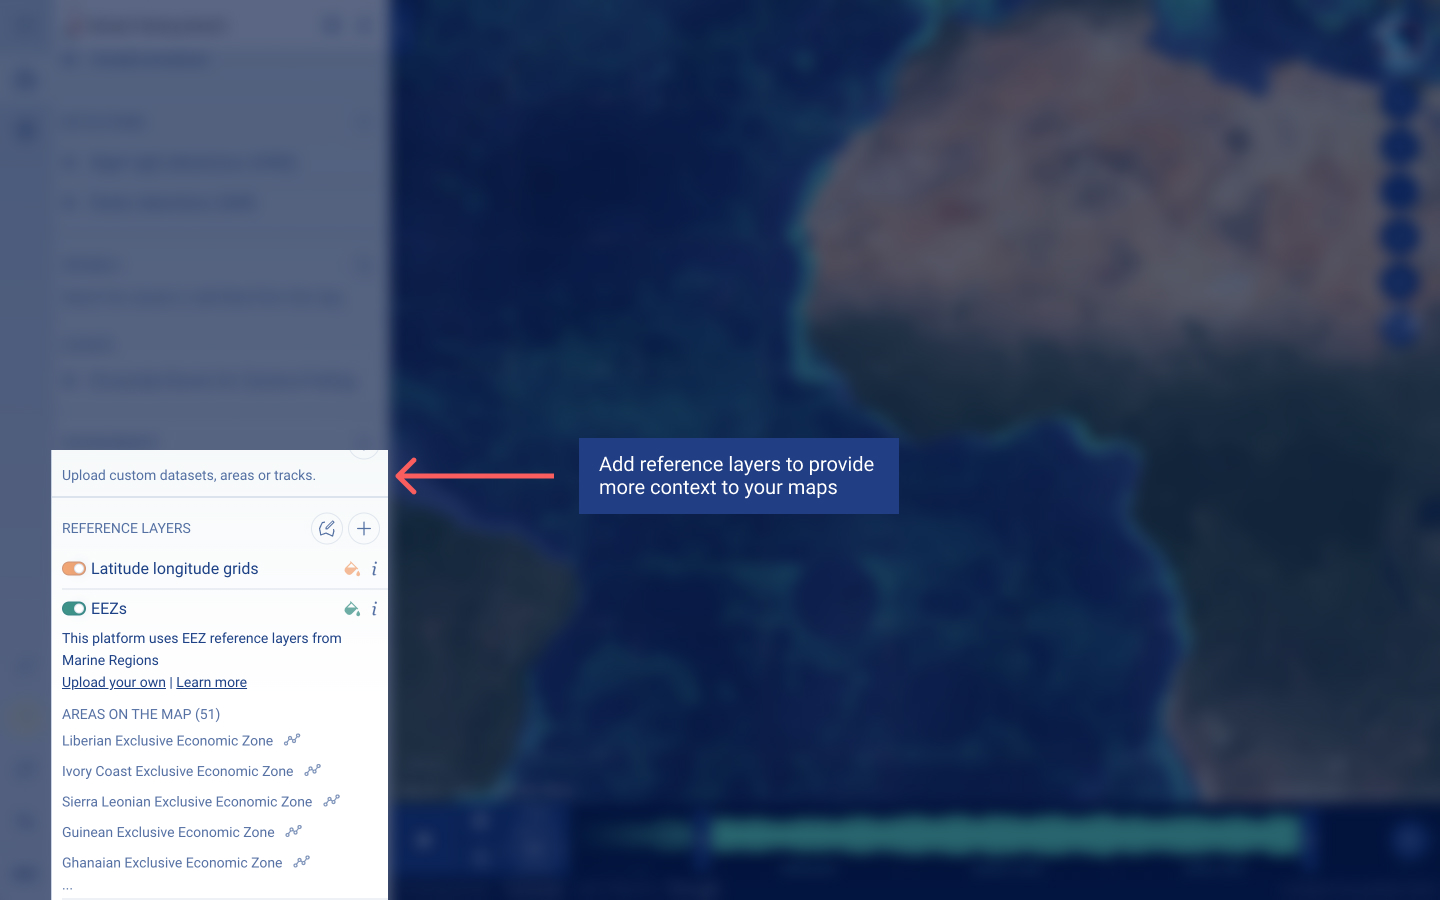
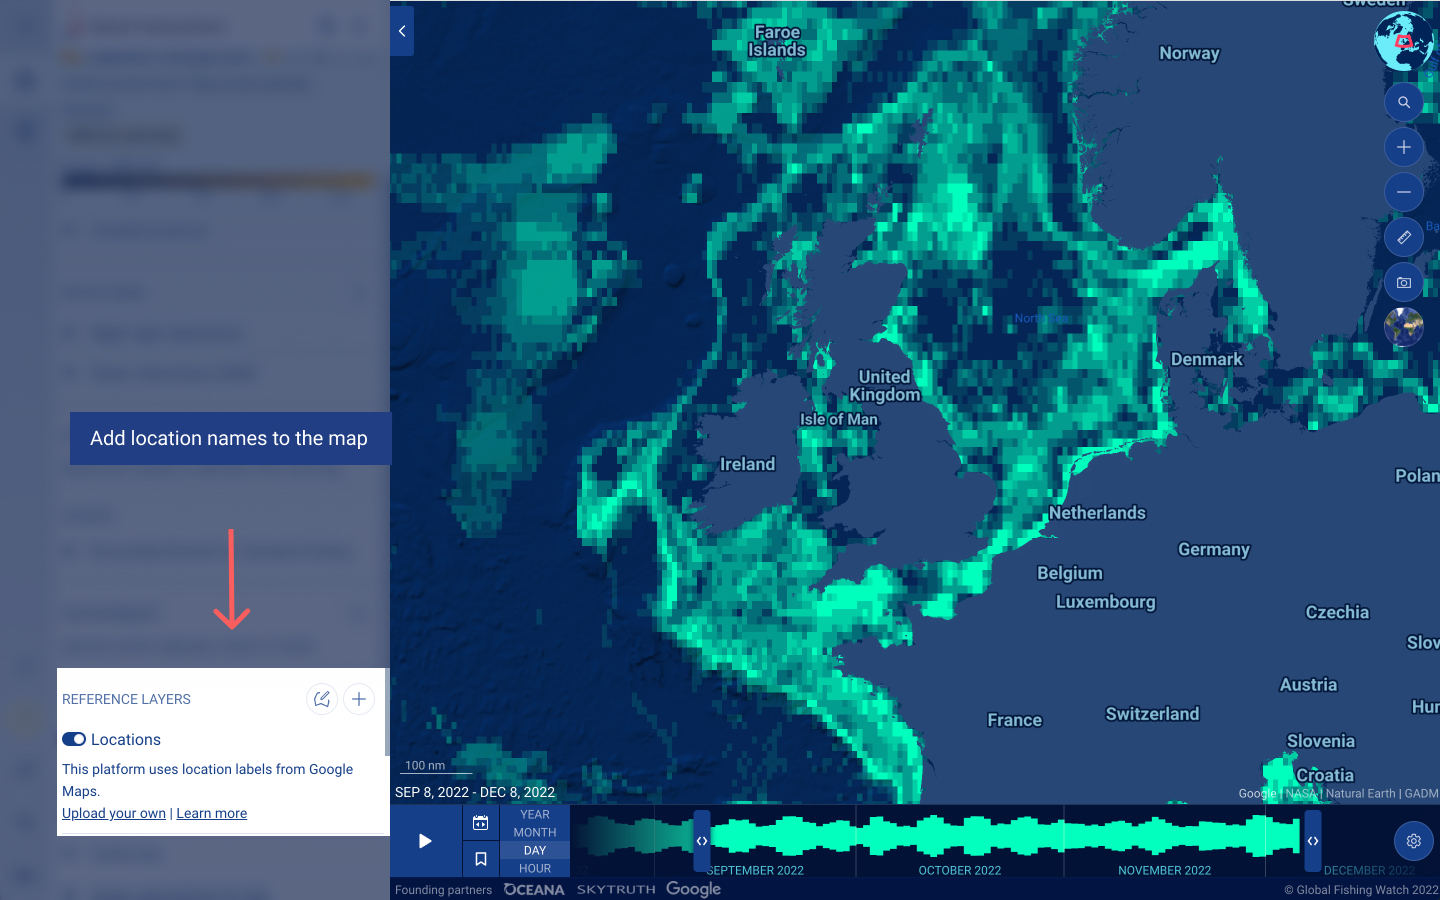
At the bottom of the left sidebar, you will find the REFERENCE LAYERS section. Reference layers can be used as a point of reference or to define an area for further exploration like analysis and data downloads.
There are several predefined reference layers that you can toggle on and off:
- Exclusive economic zones (EEZs) extend up to 200 nautical miles from a country’s coast.
- Marine protected areas (MPAs) are areas of the ocean set aside for long-term conservation. These can have different levels of protection and the range of activities allowed or prohibited within their boundaries varies considerably. We have two reference layers for MPAs. One reference layer is from the World Database on Protected Areas (WDPA). The other reference layer is from the ProtectedSeas Navigator database, which you can filter by Level of Fishing Protection, using the filter icon.
- FAO major fishing areas for statistical purposes are arbitrary areas, the boundaries of which were determined in consultation with international fishery agencies.
- Regional fisheries management organizations (RFMOs) are international bodies formed by countries with a shared interest in managing or conserving fish stocks in a particular region.
- High seas pockets are any area of the ocean beyond EEZs. High seas pockets are areas totally enclosed by EEZs.
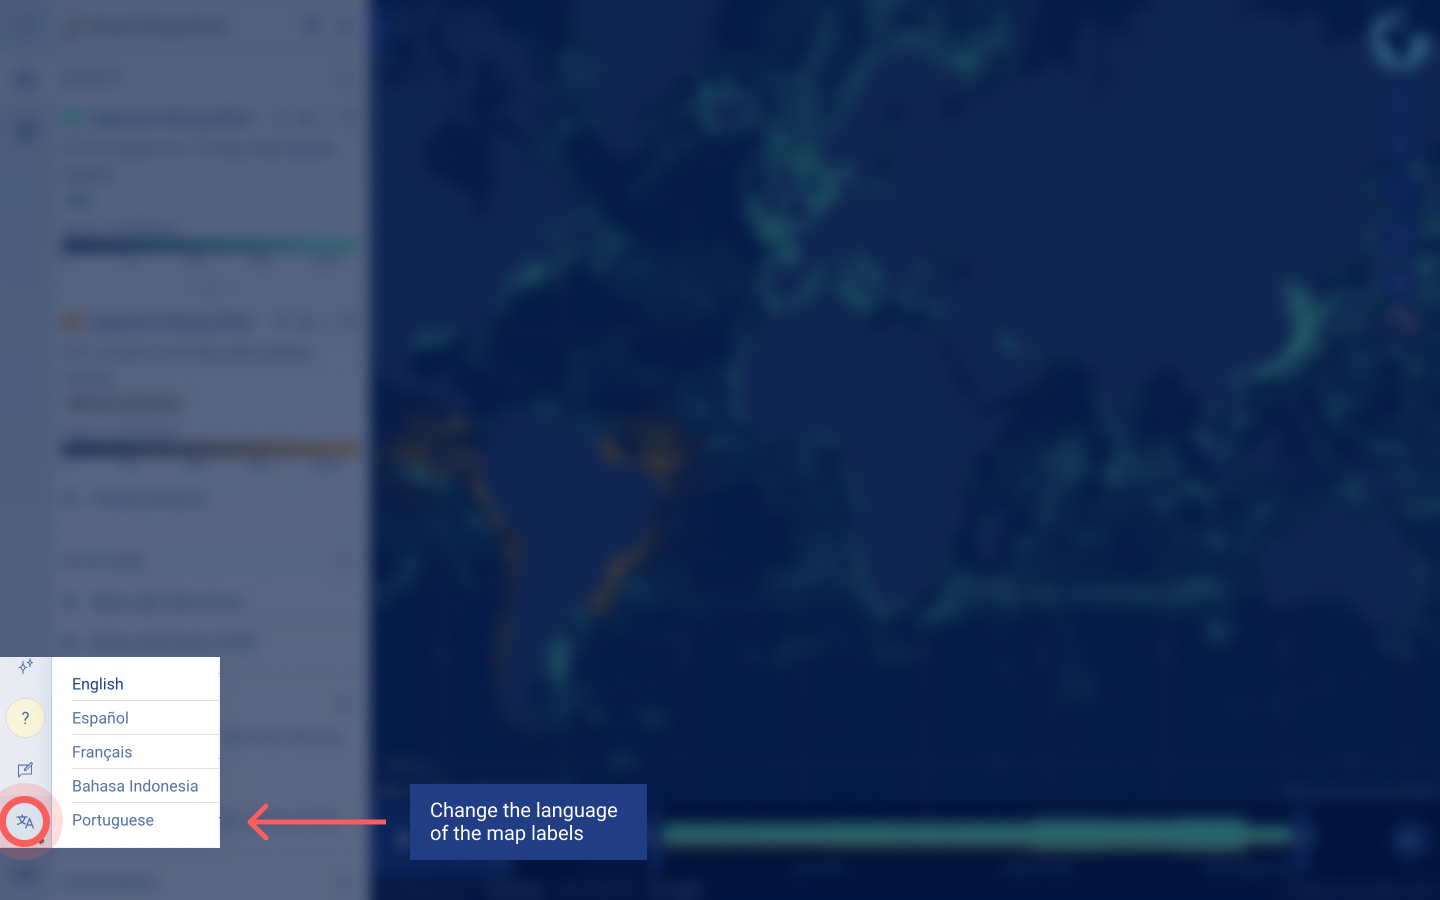
- Location names, brought in from Google Maps, can help provide orientation for the map and activity related to coastal locations. This layer contains different levels of detail as you zoom in.
In addition, you can also toggle on Latitude longitude grids, which are at 1, 5, 10 and 30° intervals depending on the zoom level of the map.
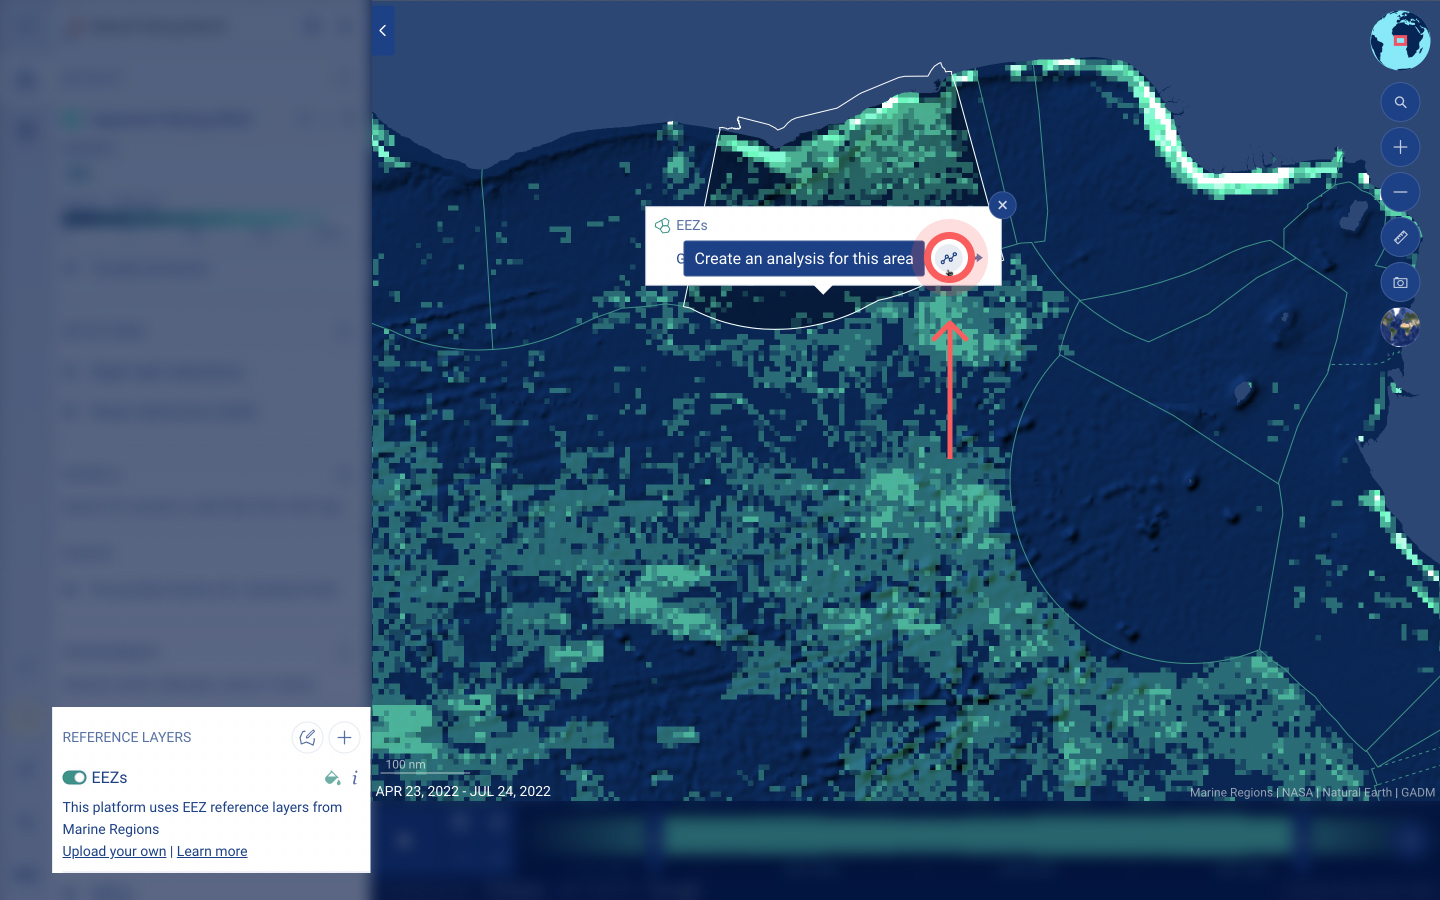
When you toggle on a layer, you will see a list of the areas present on the map highlighted in the left sidebar. Click on the graph icon next to any area to create an analysis for this area and access the dynamic report.
To sort the order of the layers visible within the map, click on the order icon and drag and drop the layers in the desired order.
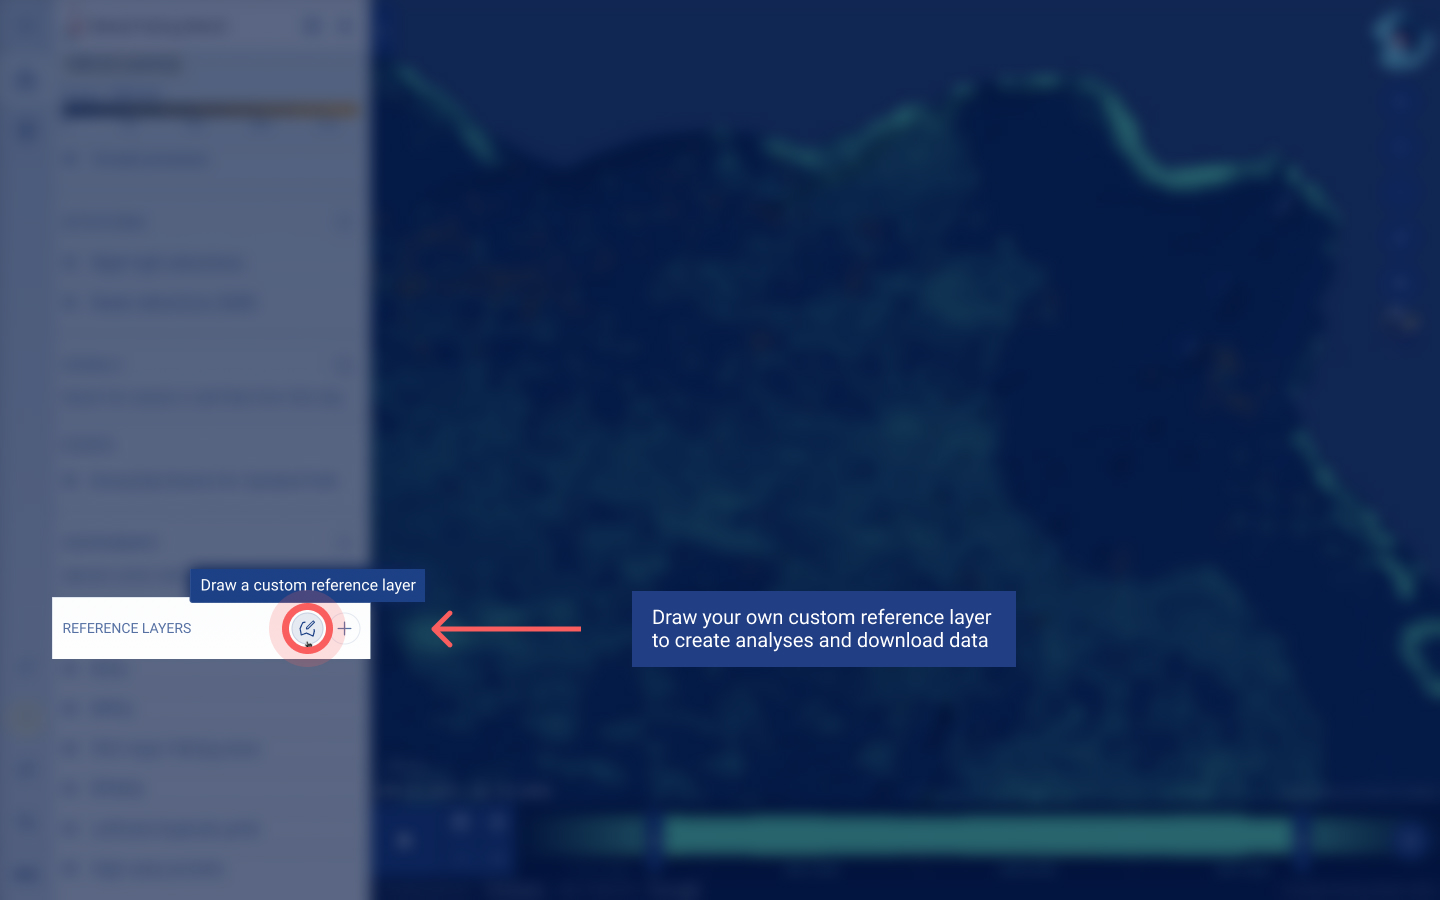
You also have the option to draw your own reference layer directly on the map. Drawing your own reference layer is useful if you would like to analyze or download human activity or environmental data from a specific area. To draw your own reference layer:
- Click on the draw icon beside the USER DATASETS section heading.
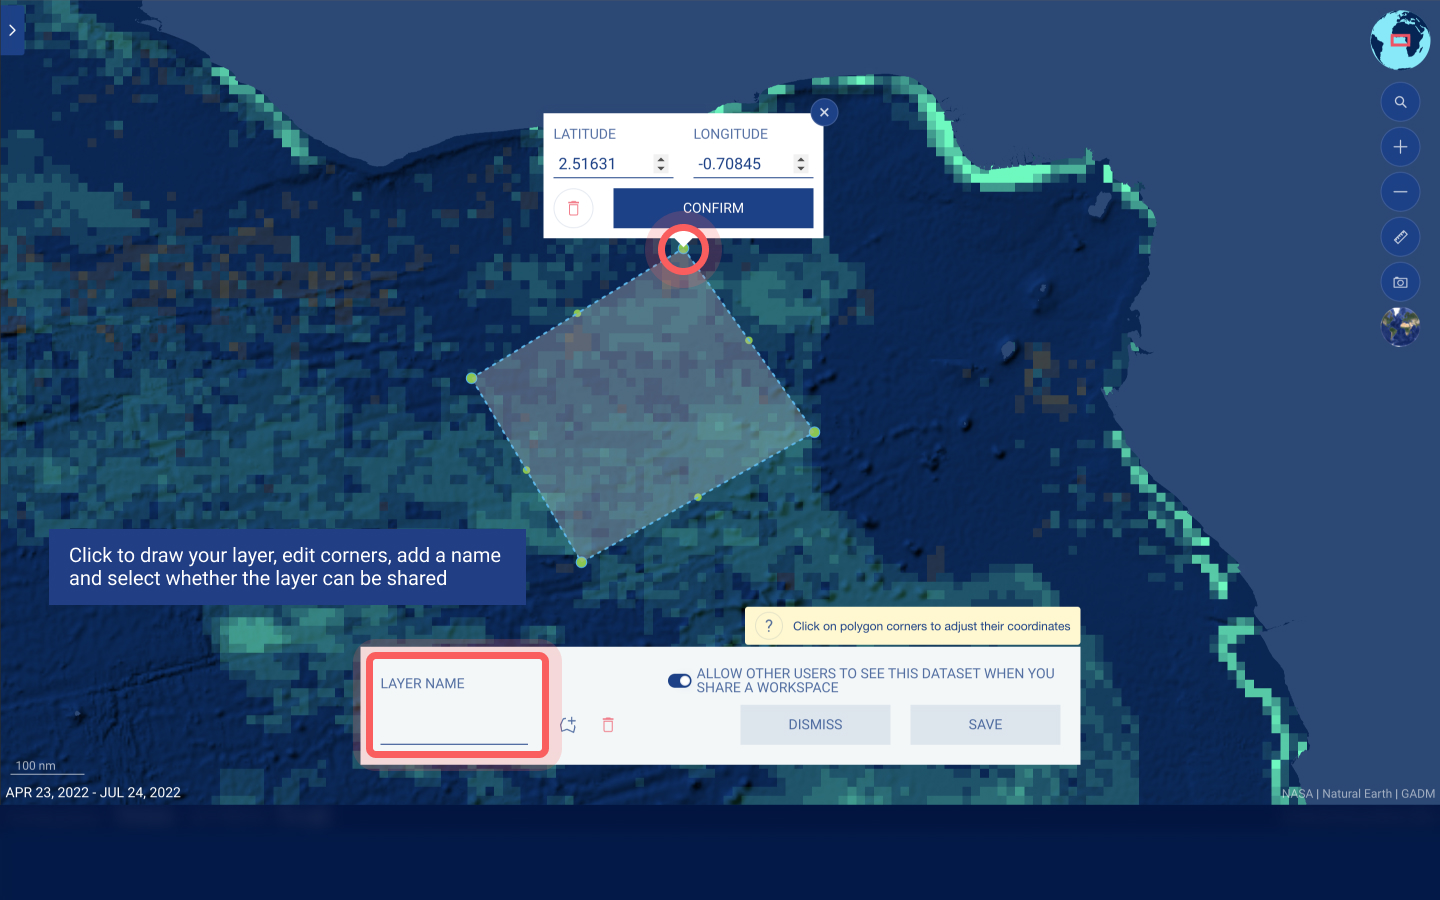
- Use your cursor to draw your area of interest.
- You can use the latitude and longitude coordinates on the map to aid your drawing.
- Click on any point to manually adjust the latitude and longitude points.
- Double-click to finish creating your polygon.
- If you would like to draw more than one polygon within the reference layer, click on the add polygon icon and draw another polygon on the map.
- Type in a layer name.
- Click the “Save” button.
The dynamic reports panel will initially show statistics for your area of interest. If you are interested in a buffer around your area of interest, click on Buffer Area. You will have the option to analyze the buffer including the area of interest or only the buffer.
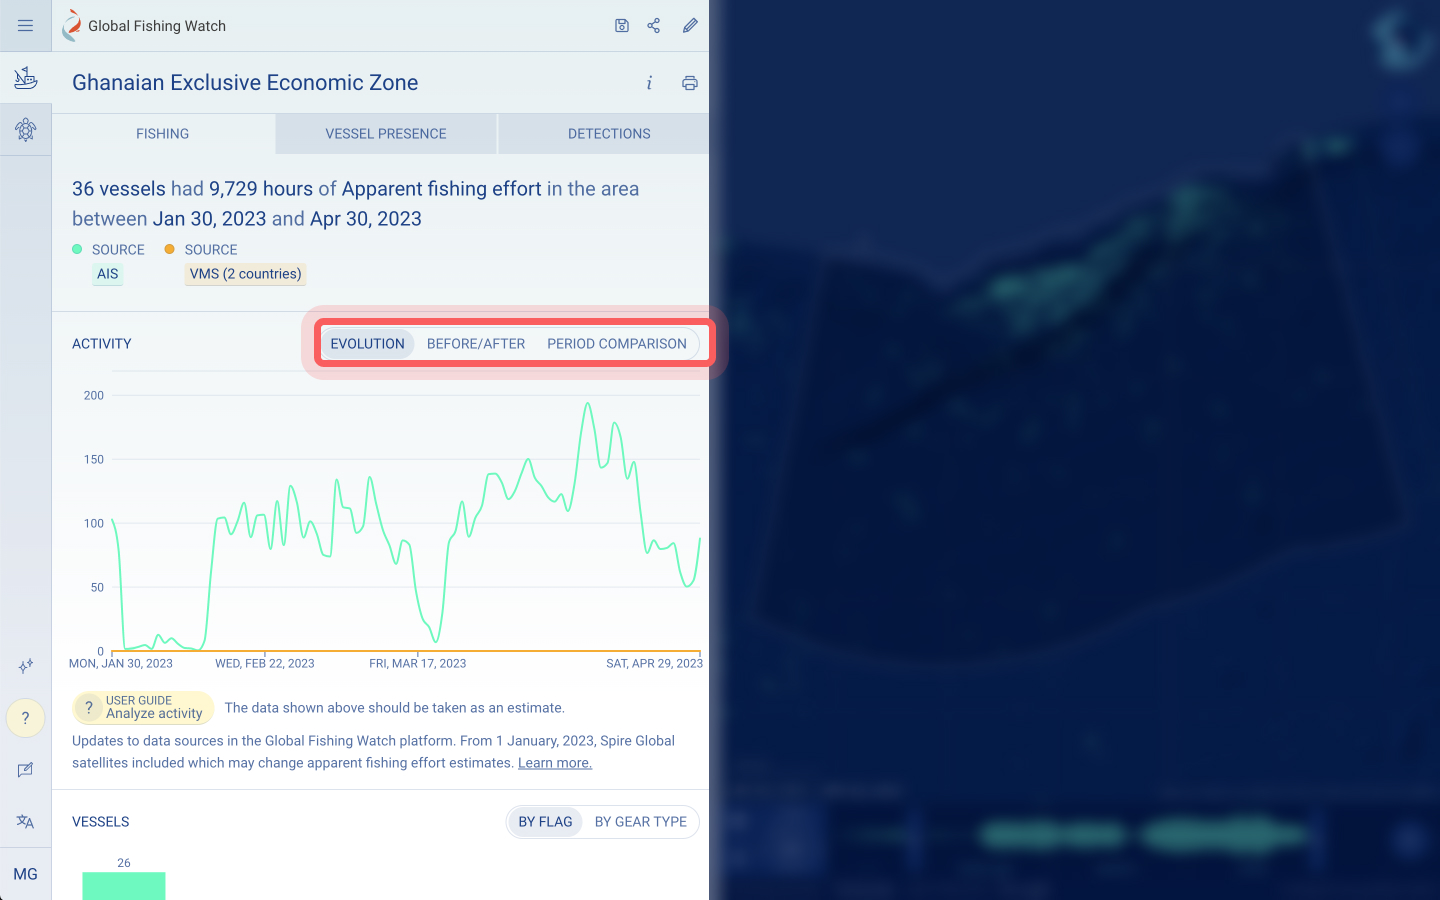
It also shows the Evolution of the data over time, which is presented in a graph.
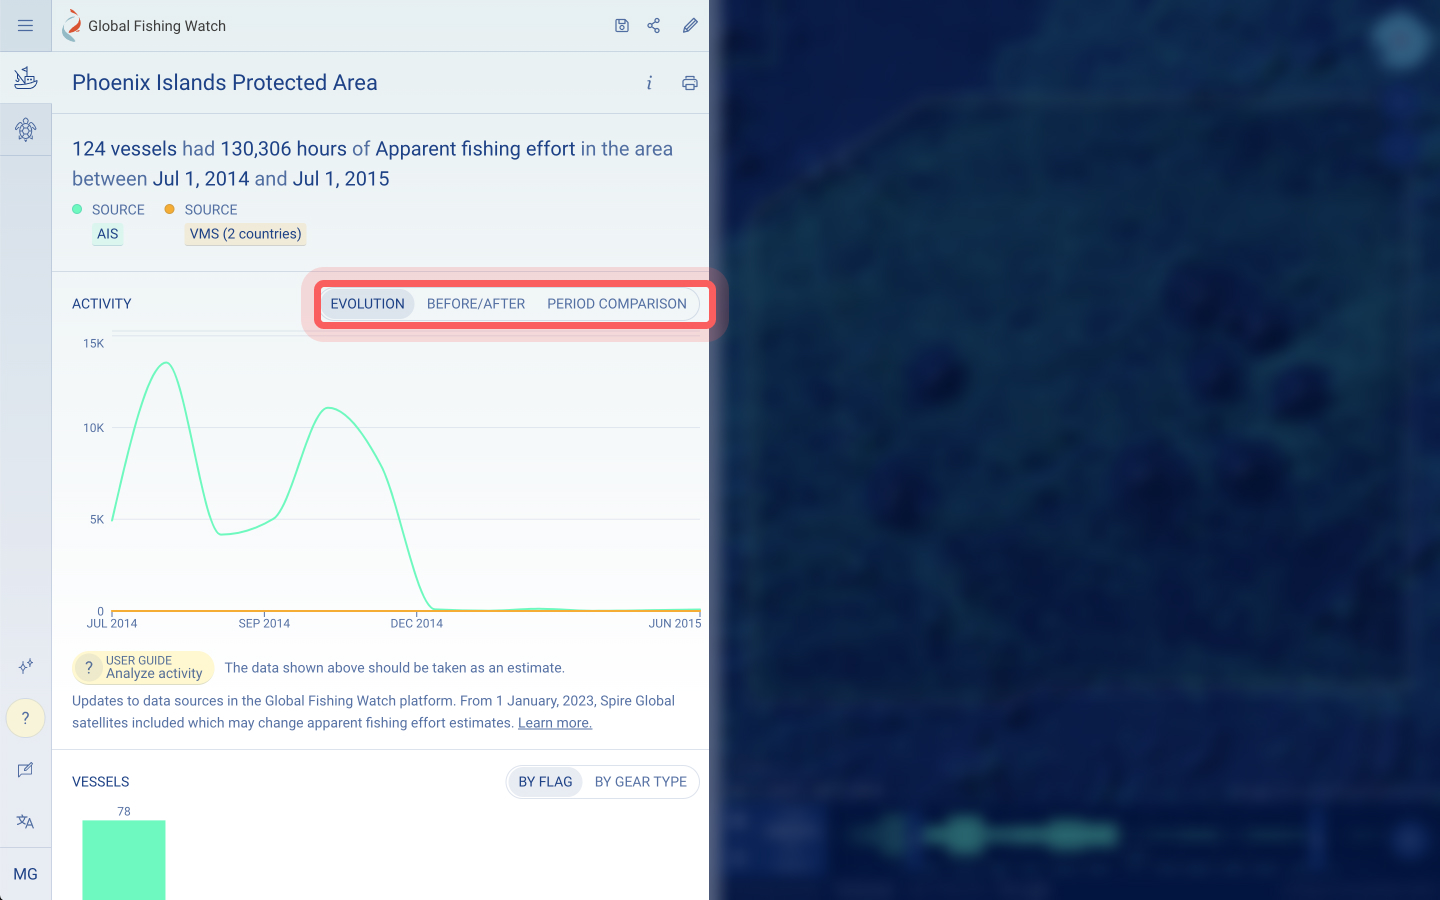
The two spatiotemporal analysis options include:
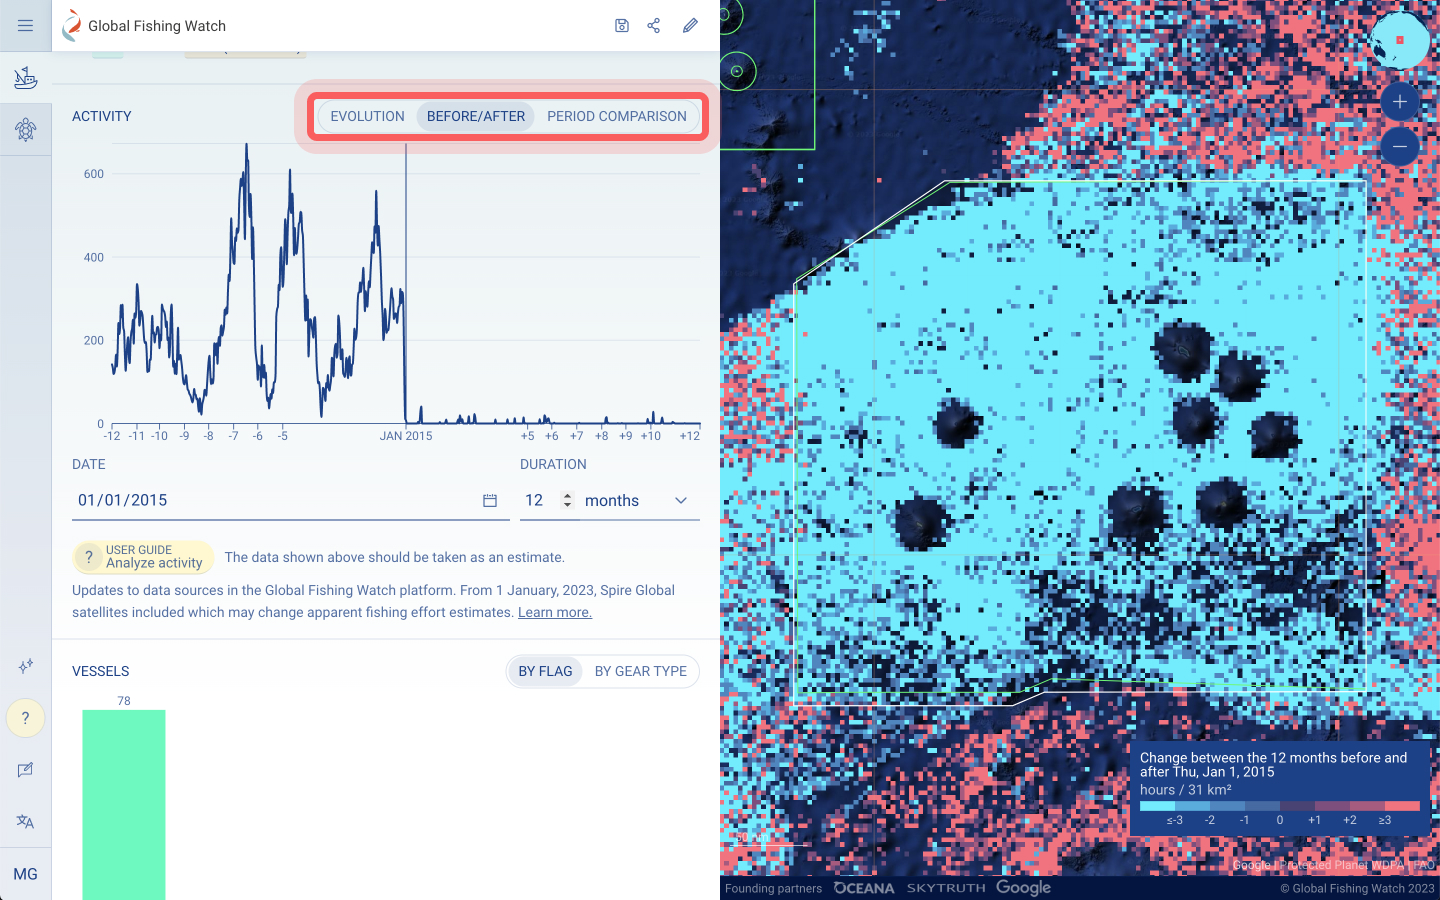
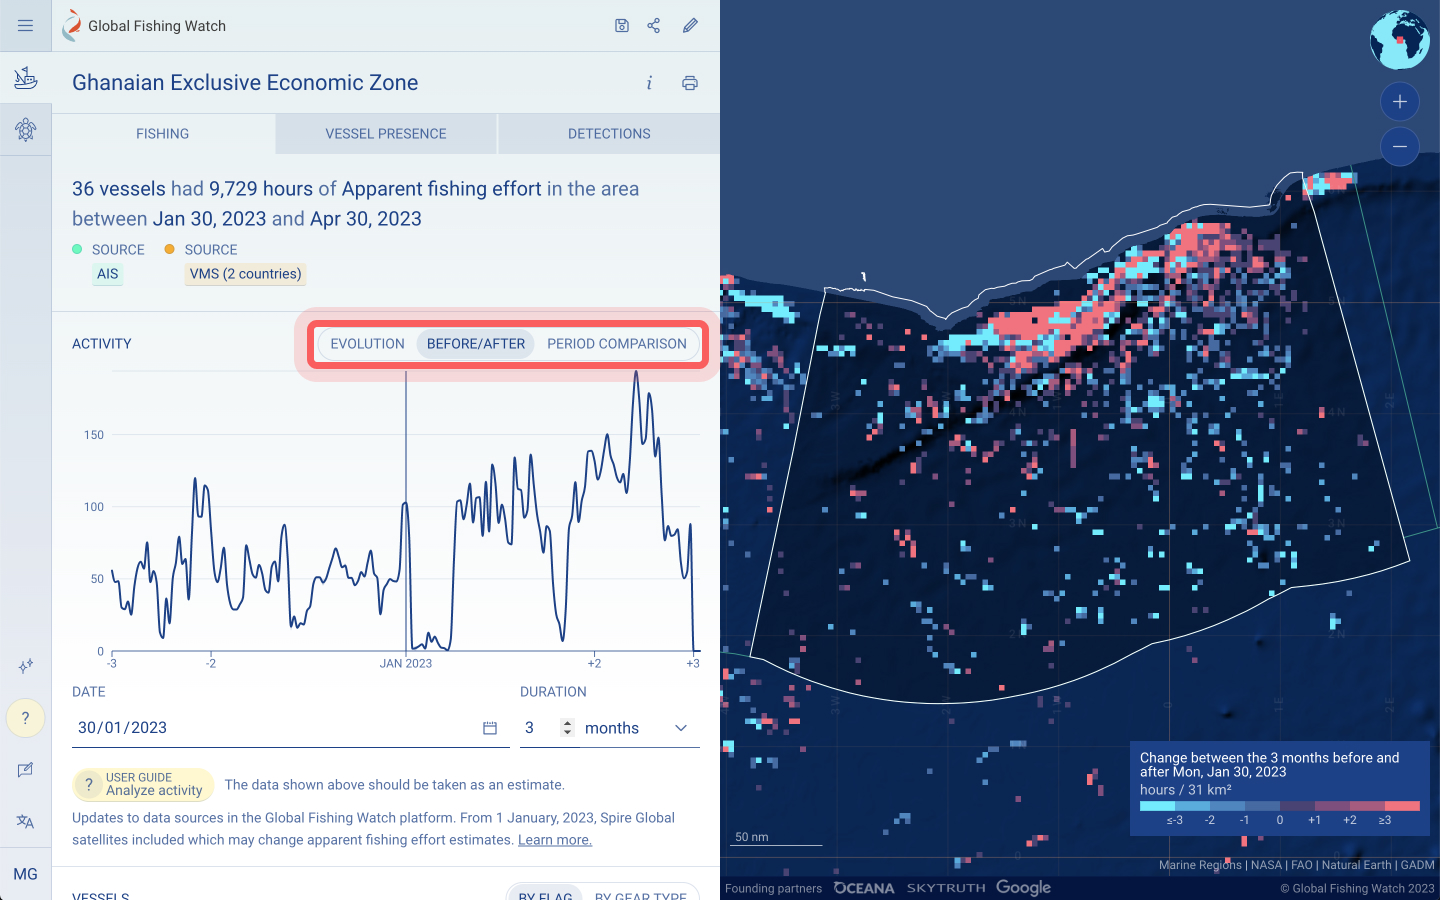
- The Before/After analysis compares activity, including fishing effort or vessel presence, before or after a specific point in time. This could be useful to compare activity after management changes, like the implementation of a closed area.
- The Period Comparison analysis compares changes in activity between two non-consecutive time periods. Examples could include differences in fishing activity within a year in different seasons, or comparisons of a certain month each year.
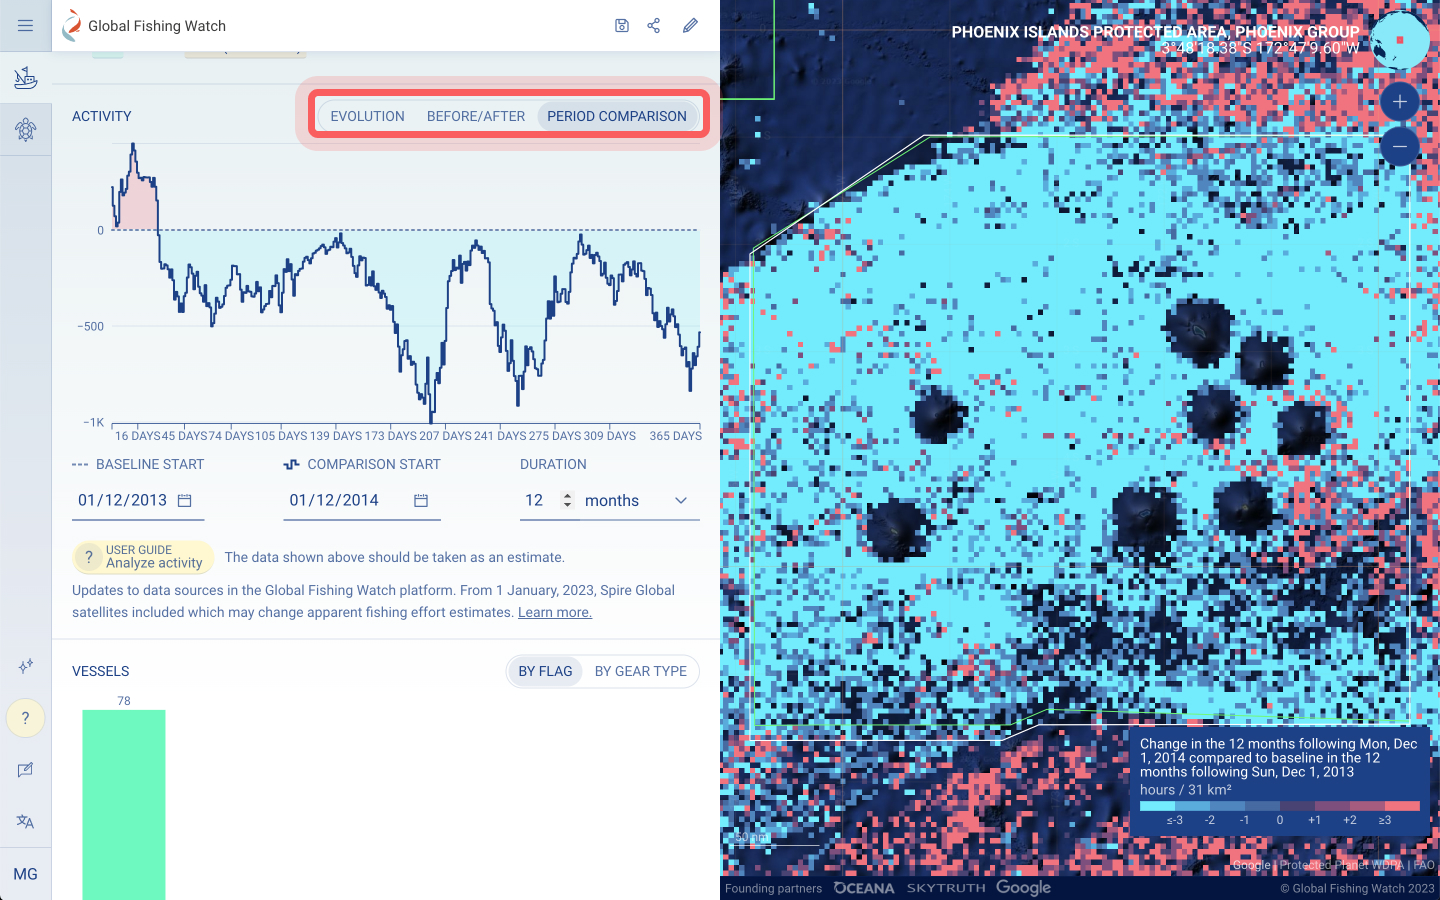
In other words, if the time periods you are comparing are consecutive, use the Before/After analysis. If the time periods that you would like to compare are not consecutive, use the Period Comparison analysis.
For both spatiotemporal analysis options, you can set the criteria for your analysis, including the date and a duration. For the Before/After analysis, the date is the point in time that you would like to use for the comparison. The duration is the amount of time that you would like to compare before and after the date that you have selected. For the Period Comparison analysis, set the criteria for your analysis by selecting a baseline start, comparison start and duration. The baseline start is the date that will be used to compare changes in activity. The duration can be set depending on your interest.
When selecting dates, consideration should be given to how the calendar can influence human activity. For example, a national holiday may be on different days in consecutive years, which can influence fishing or activity patterns.
Explore the results via the graph by hovering over points. Within the map, you can also click on the grid cells to explore specific points. The legend at the bottom right hand corner of the map provides a color index for visual representation of any changes in activity.
The distribution of vessels present in your area of interest can be explored in the dynamic report. A breakdown of the vessels by flag State, vessel type, or gear type may be viewed in a bar chart.
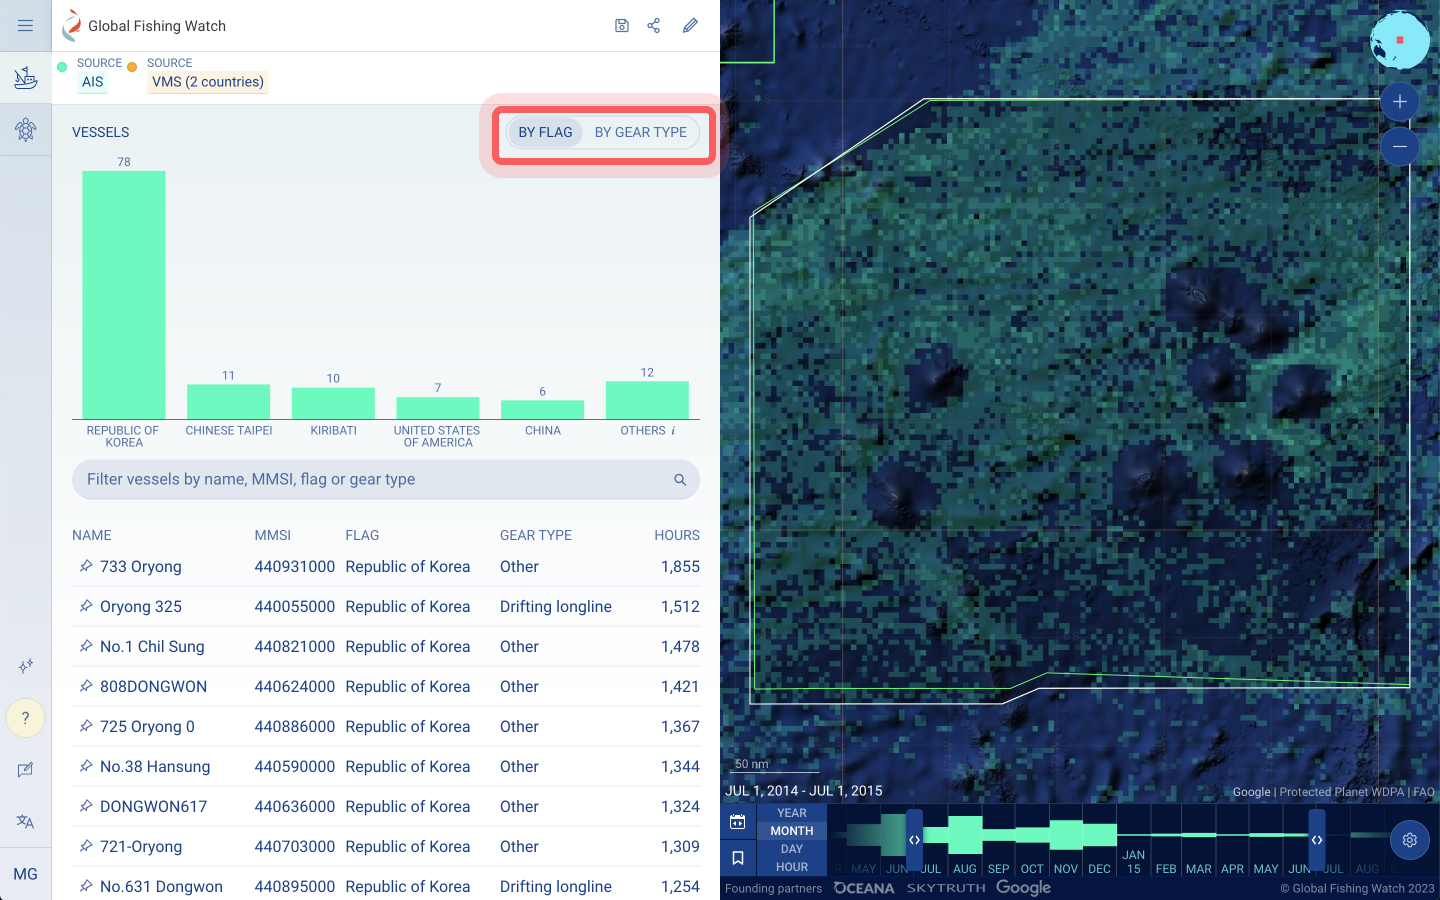
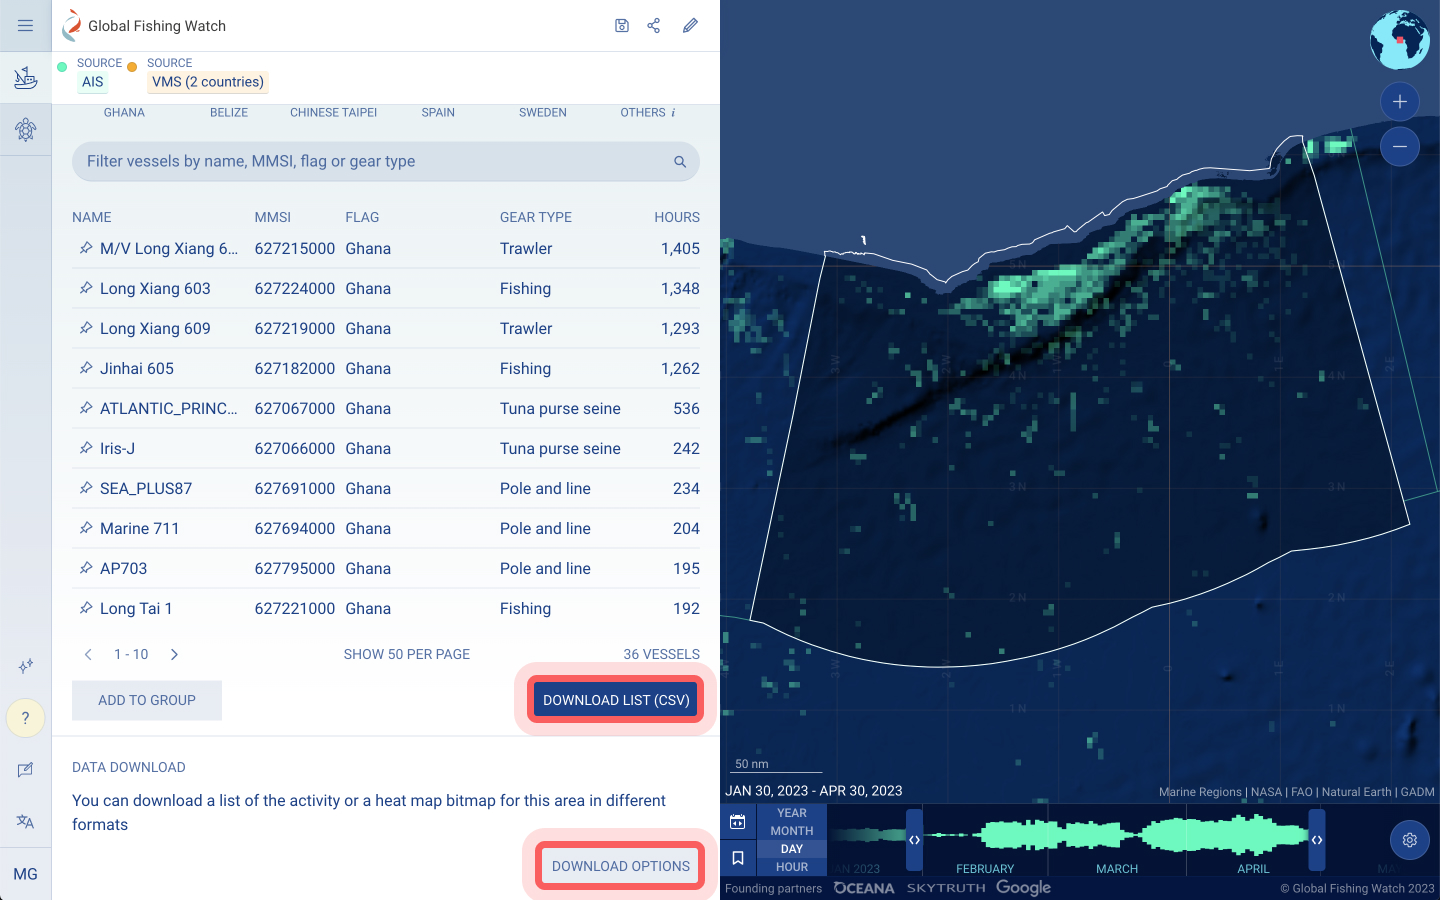
You can view a full list of vessels in your area of interest and filter the vessels using the search bar. The vessel list will automatically update based on the search terms and you can search for multiple terms and use a dash to exclude values. The list of vessels is sorted based on the most active vessels within the area.
If you are interested in a specific vessel, pin its track to the map. To explore a group of vessels, select “Add to group.” This will add the vessels in the list to a new or existing vessel group.
Options for accessing specific data in the dynamic report:
- To download a subset of vessels based on what you have filtered, select “Download CSV”
- To download the full vessel list in several formats, select “Download Options”
- To share the entire dynamic report as a PDF, click on the print icon that is located at the top right hand corner of the panel
- To share the link to the report with anyone to access the same information
- To save the dynamic report, use the save icon, which will store the report in your profile to access later
- Toggle on the EEZs layer in the REFERENCE LAYERS section within the left sidebar.
- Click on the region you are interested in exploring further, such as Ghana’s EEZ, then click on the graph icon .
- Explore the fishing effort in a time series graph for the region and time period that you selected in the analysis panel. Select a buffer, by clicking on the button Buffer Area, if you would like to define and explore a buffer around your area of interest.
- You can toggle between two other analysis options: “Before/After” and “Period Comparison.”
- For each analysis option, you can set the criteria for your analysis, including the date around which you would like to compare and duration.
- You can explore the results by hovering over specific points in the graph and map.
Before/After analysis:
Period Comparison analysis:
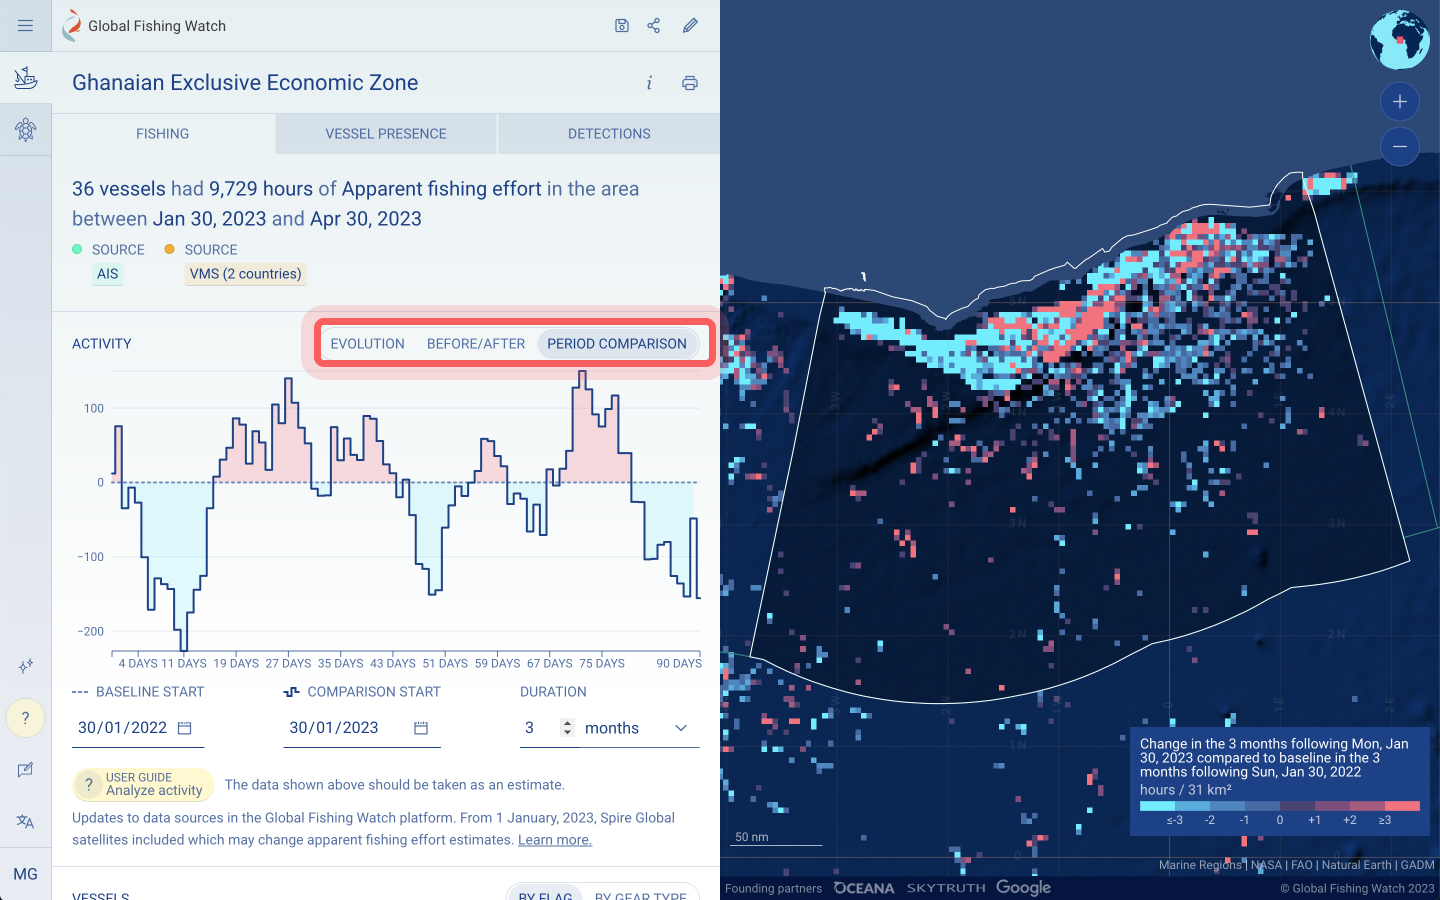
- The scale at the bottom right-hand corner of the map will provide you with a visual representation of any changes during the time period that you would like to explore. In this example, blue shows an activity decline and red shows an activity increase.
- To download the underlying data of the analysis, click on the “Download Options” button located at the bottom of the side panel.
Learn more by watching this tutorial on the analysis tools in the Global Fishing Watch map.
Within the Global Fishing Watch platform, you can save and share your current view of the map, known as a workspace. Saving and sharing your workspaces can be useful when you have added your own environment or reference layers, clicked on specific vessel tracks or are analyzing data in a specific area during a specific time range. When others follow your shared link, they will immediately be brought into the context you created for them to pick up on your collaboration.
In the left sidebar, you can save your workspace by clicking the save icon and share your workspace by clicking the share icon .
When you click on the save icon, you will be able to choose a name for your workspace that you can later access from your profile located in the bottom left corner of the sidebar.

When you click on the share icon, a link to your specific workspace will be copied directly to your computer’s clipboard to be shared with others.
You can also create workspaces that only you can access. Learn more by watching this tutorial on creating private workspaces.
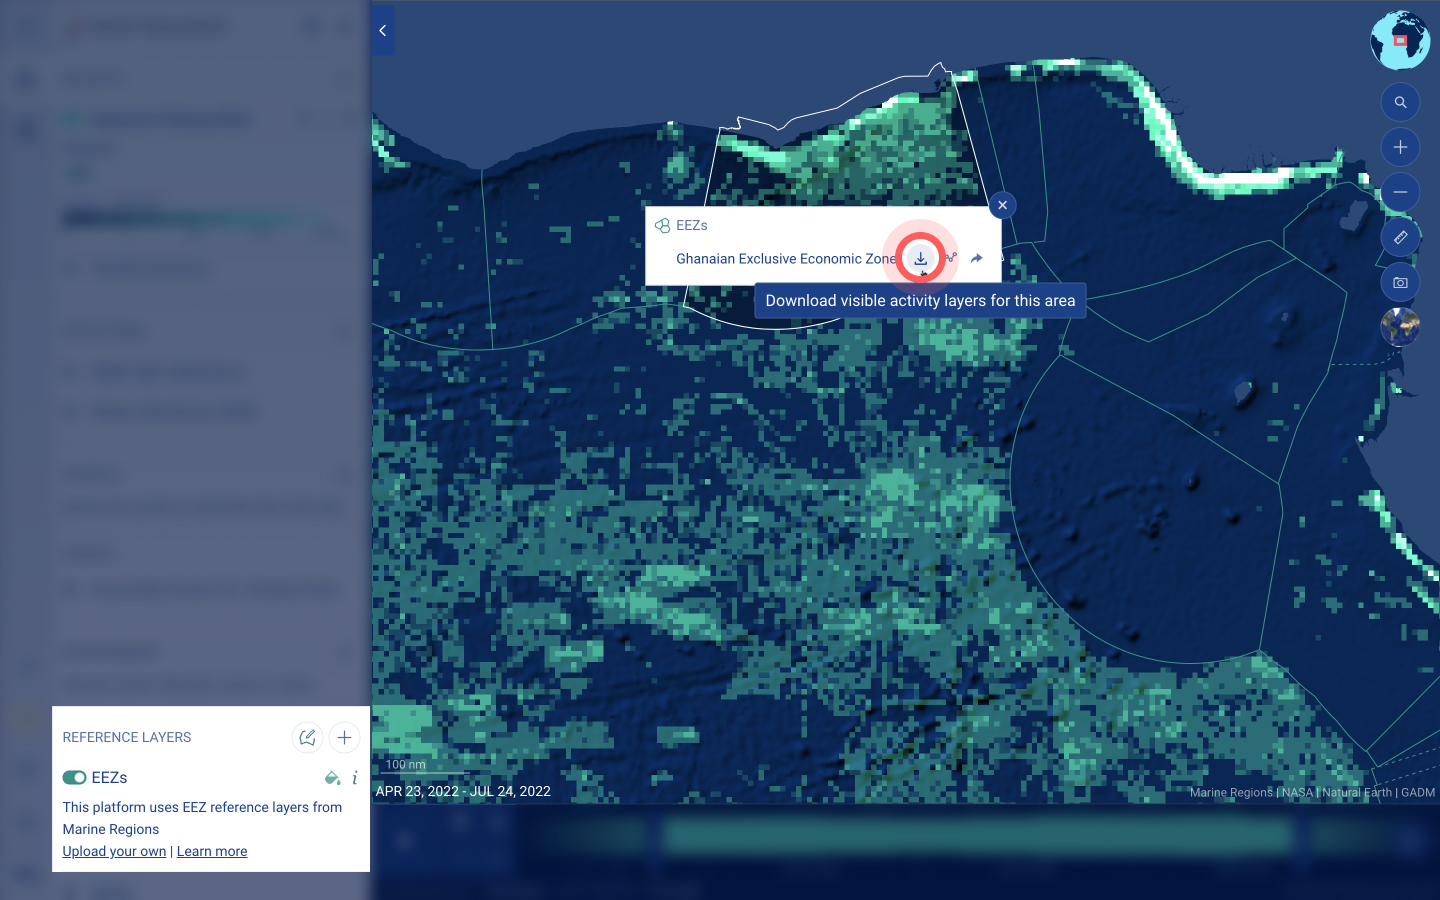
- Toggle on the EEZs layer in the left sidebar in the REFERENCE LAYERS section.
- Click on Ghana’s EEZ, then click on the data download icon .
- Ensure that you have selected a time range of less than one year within the timebar and that the source for the apparent fishing effort layer that is toggled on is AIS.
- On the data download pop-up, you can select if you would like to download data without spatial attributes from the ACTIVE VESSELS tab or with spatial attributes from the GRIDDED DATA tab
- Within the data download pop-up, you can select the format, how you would like the data to be grouped within each grid cell, as well as the temporal and spatial resolution.
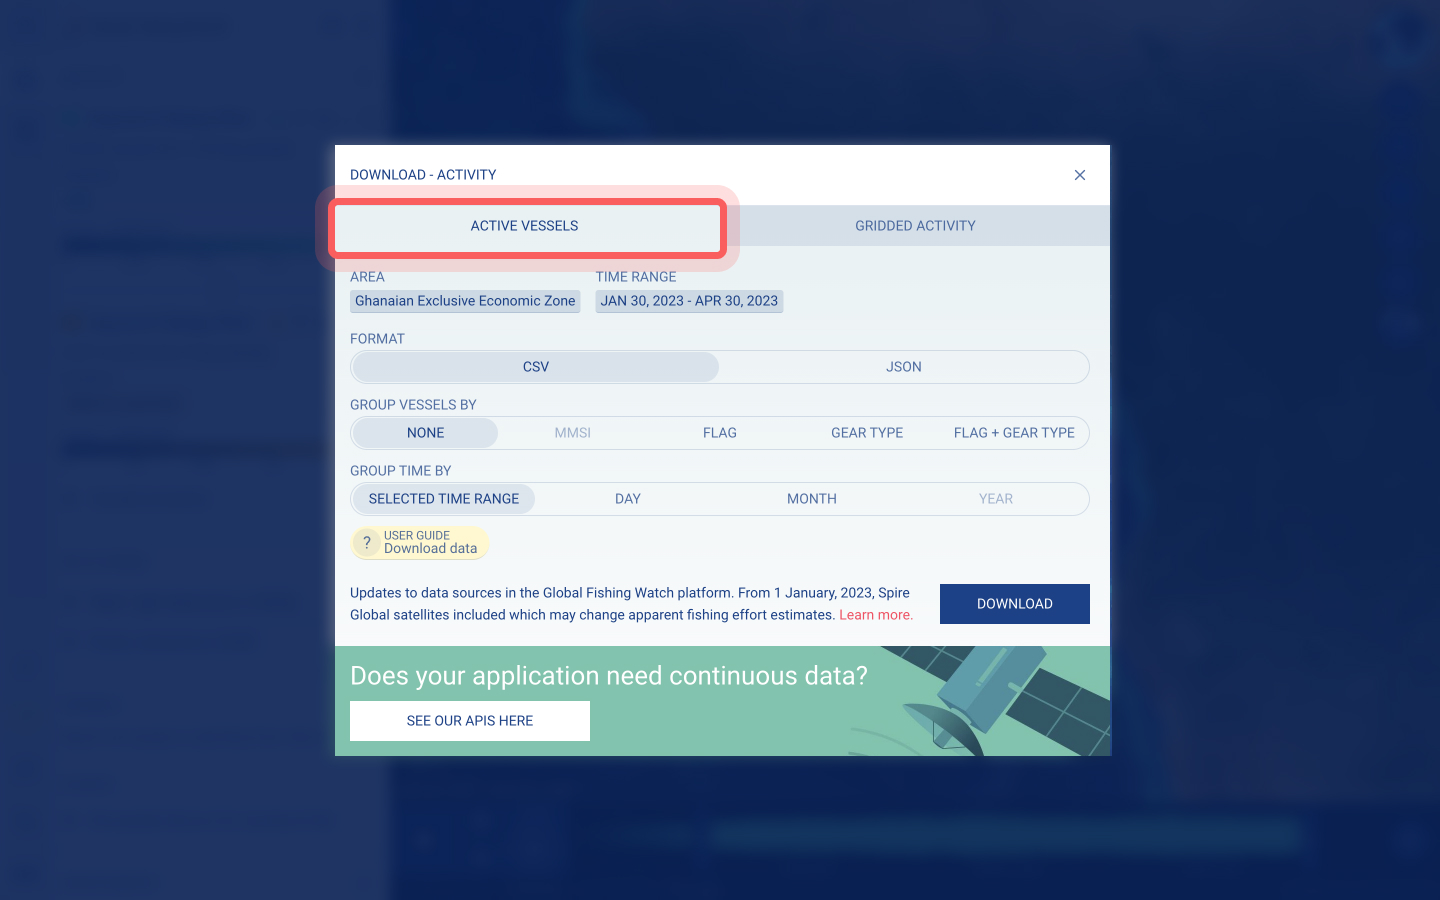
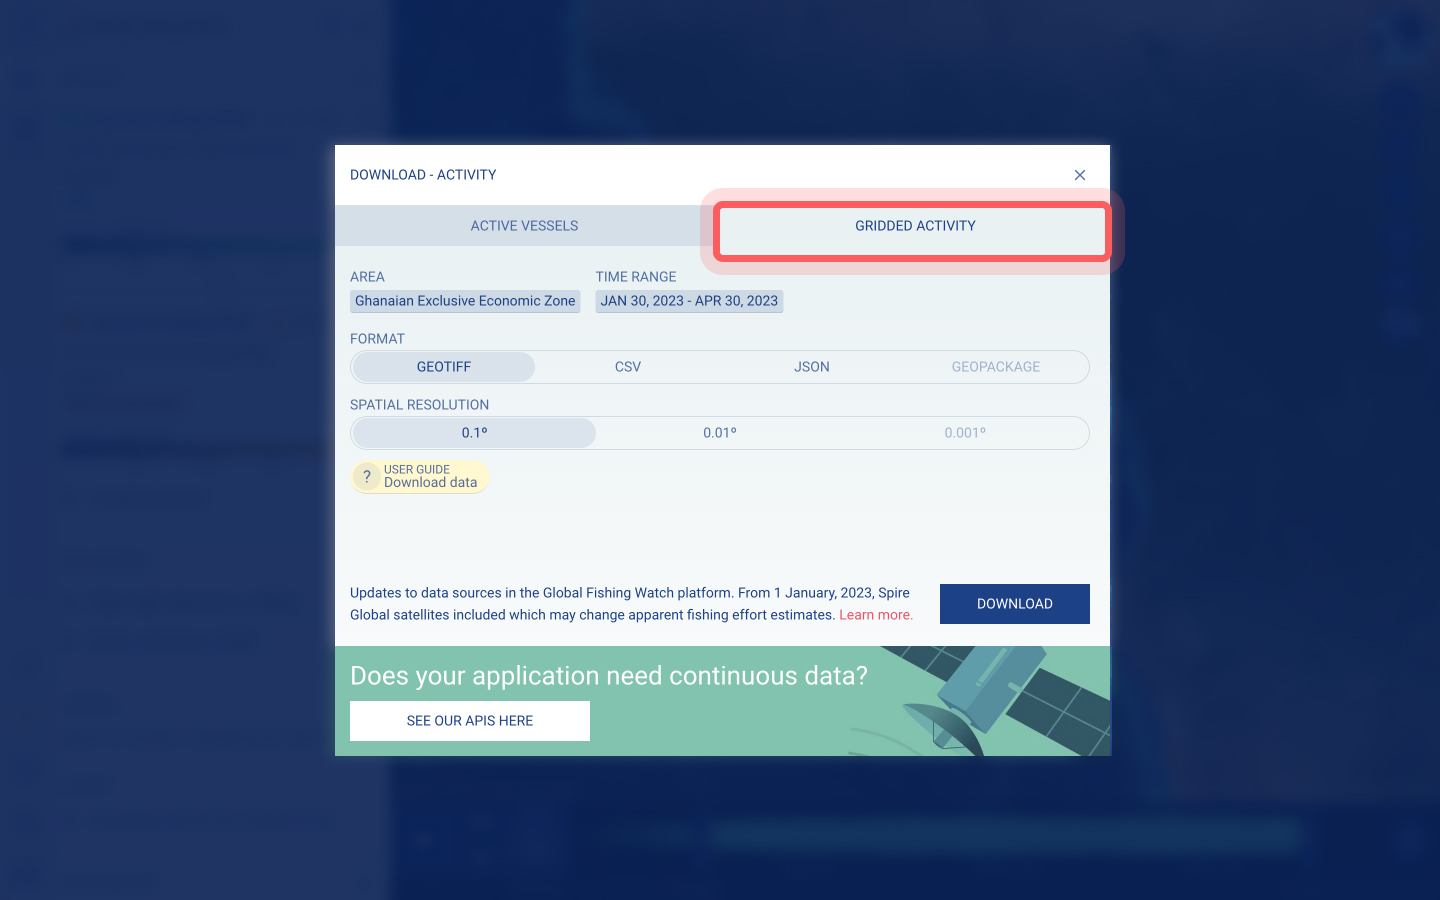
- Click the download button at the bottom of the pop-up window and wait for your data to be downloaded directly to your computer.
Learn more about data downloads and formats by watching this tutorial on downloading data from the Global Fishing Watch map.
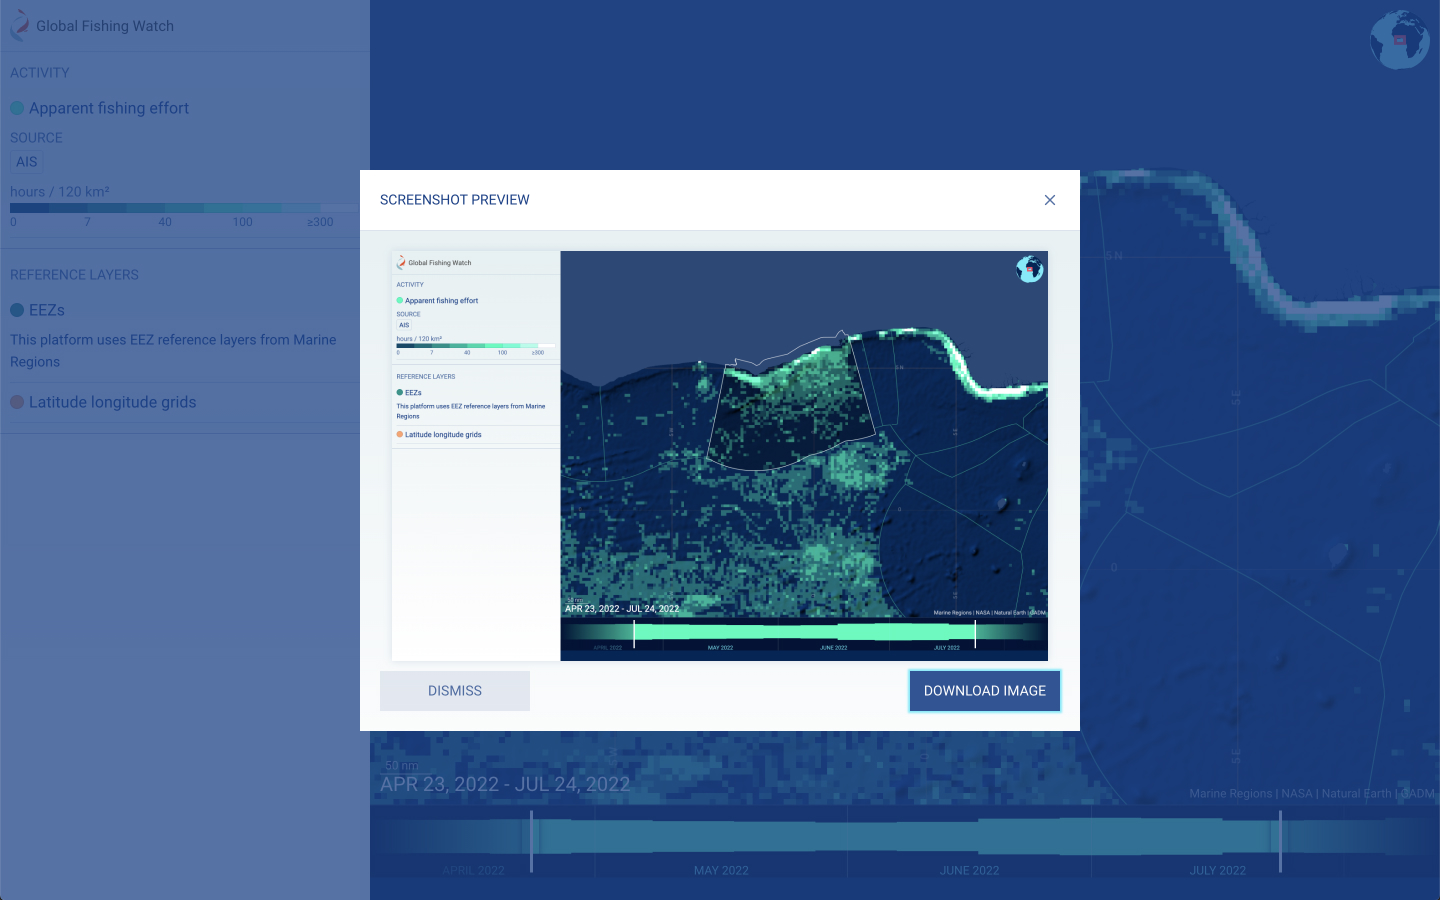
To take a screenshot of your current workspace, click on the camera icon located on the right-hand side of the map. A pop-up will appear to download the image.
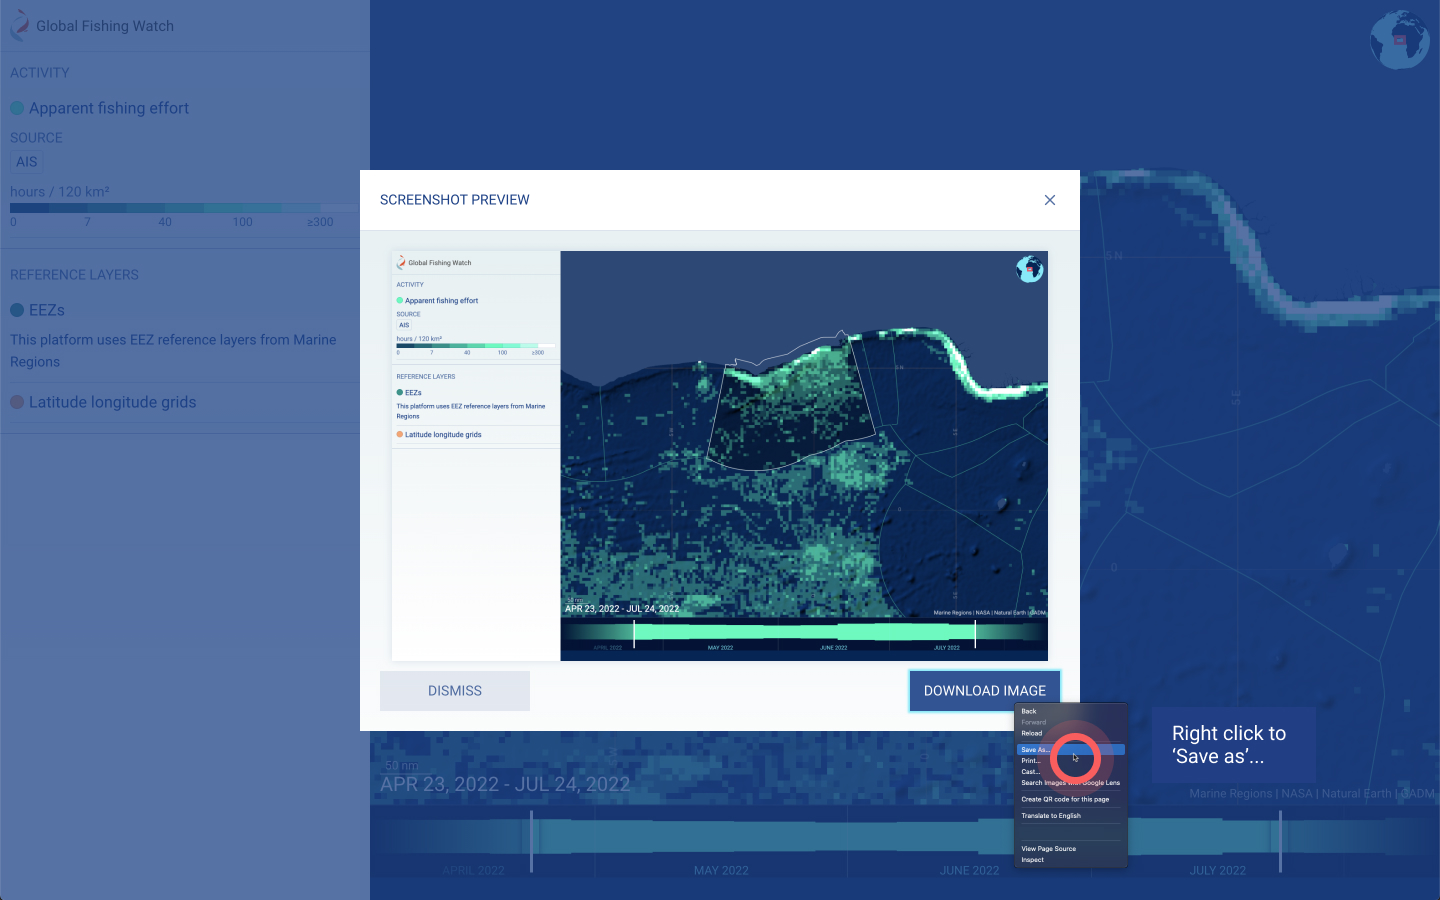
If you would like to define the name or the location of the screenshot on your computer, right click on the “Download Image” button and select “Save As…”.
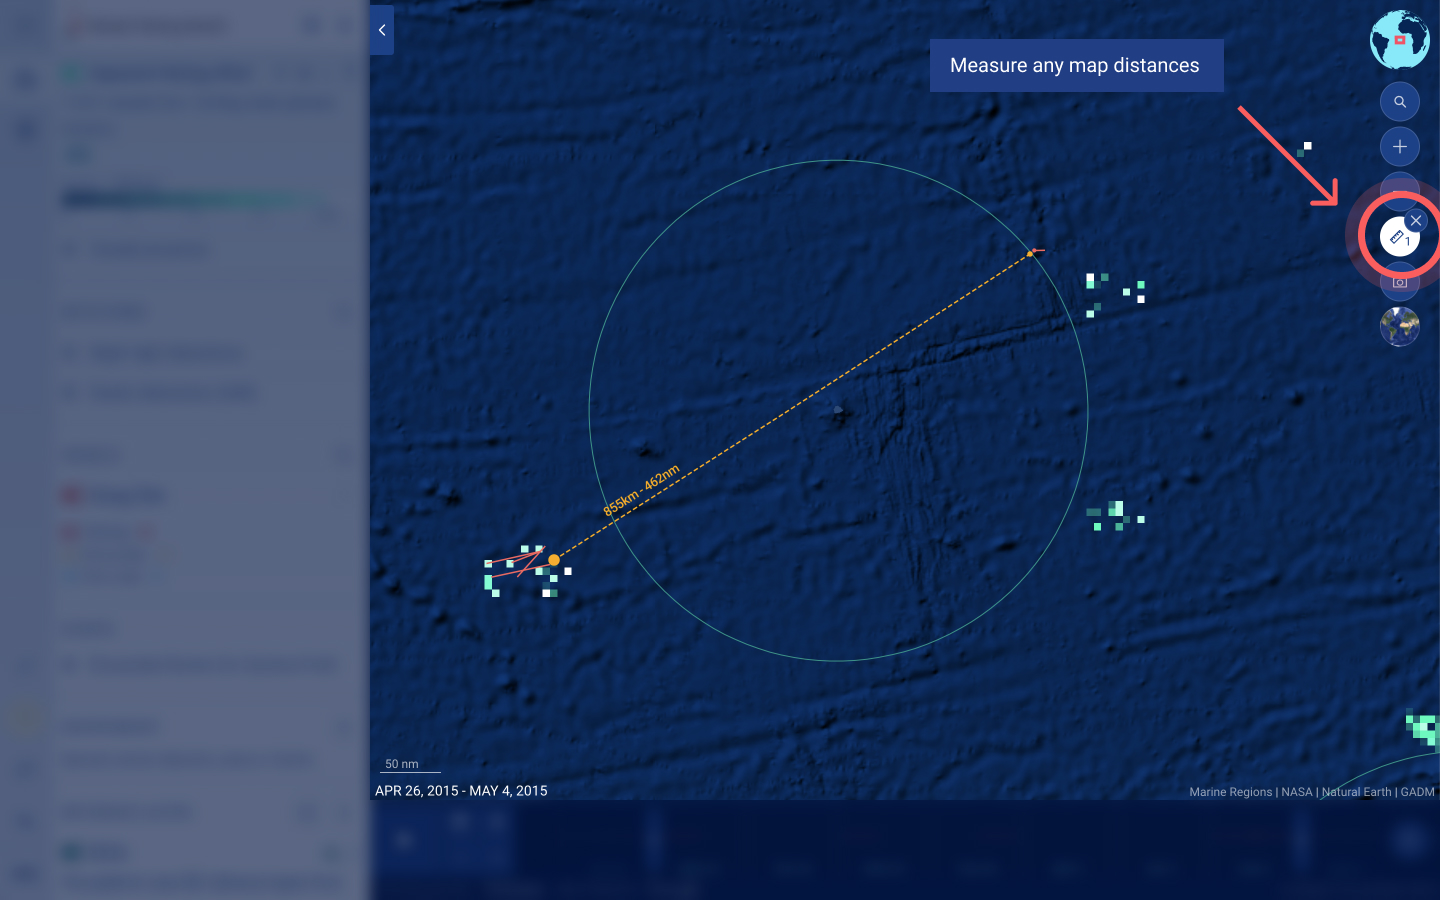
To measure distances on the map, use the ruler icon located on the right-hand side of the map.
If the distance does not display automatically, use your cursor to zoom in to read the measurement.
The marine manager portal includes private workspaces for marine managers and researchers to interpret relevant data. The workspaces include tools to generate spatial and time-series analysis and visualize multiple layered datasets.
To access the marine manager portal, you can:
- Set up a workspace, via any area, including an MPA, EEZ, ocean or sea.
- Select a partner site.
- Or explore the global map and save a workspace after panning and zooming to the area of your choice.
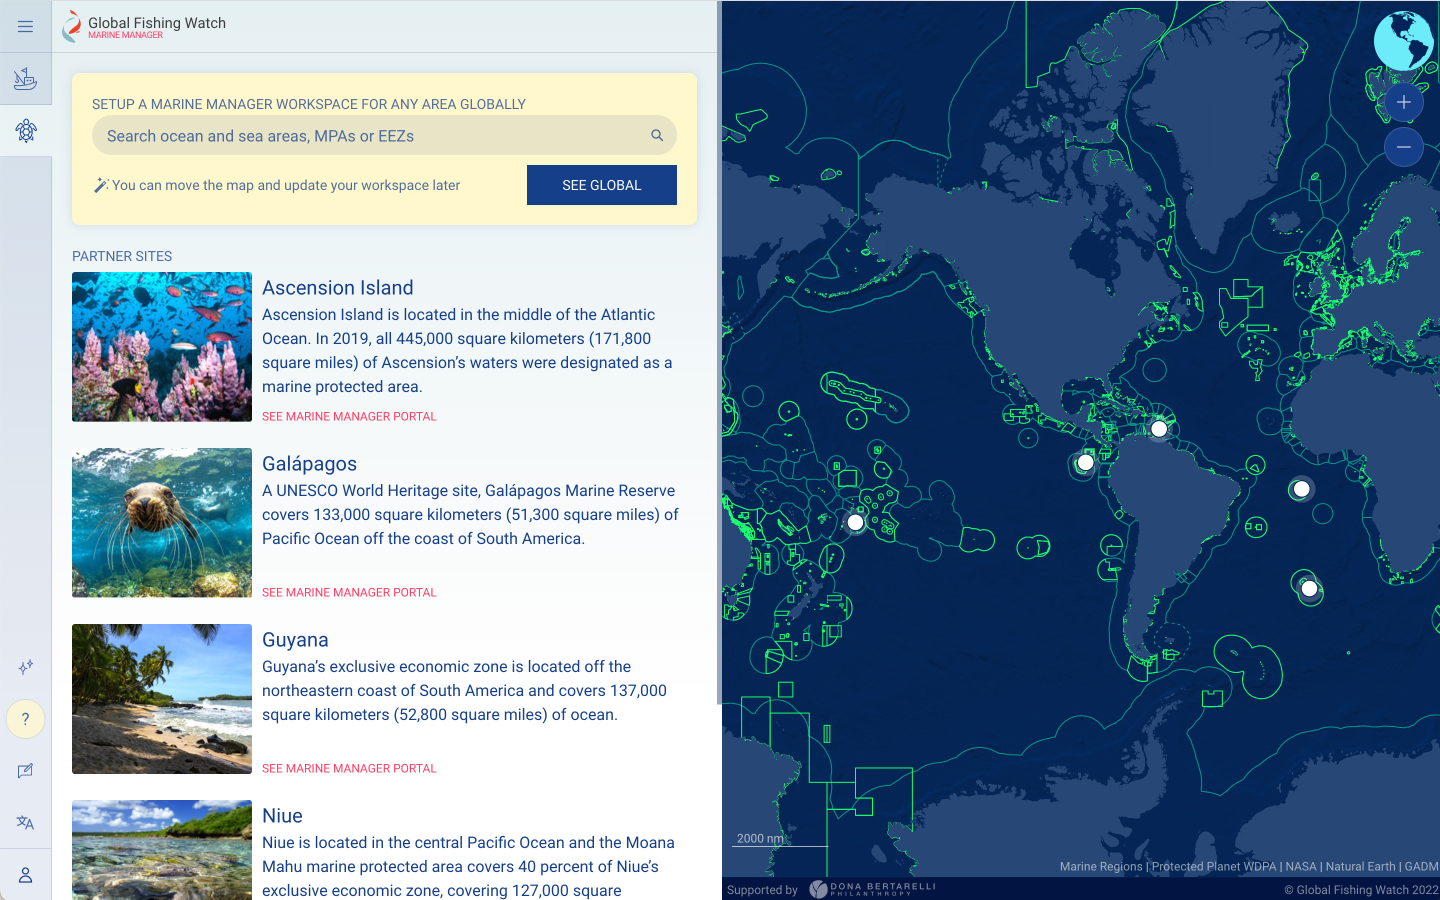
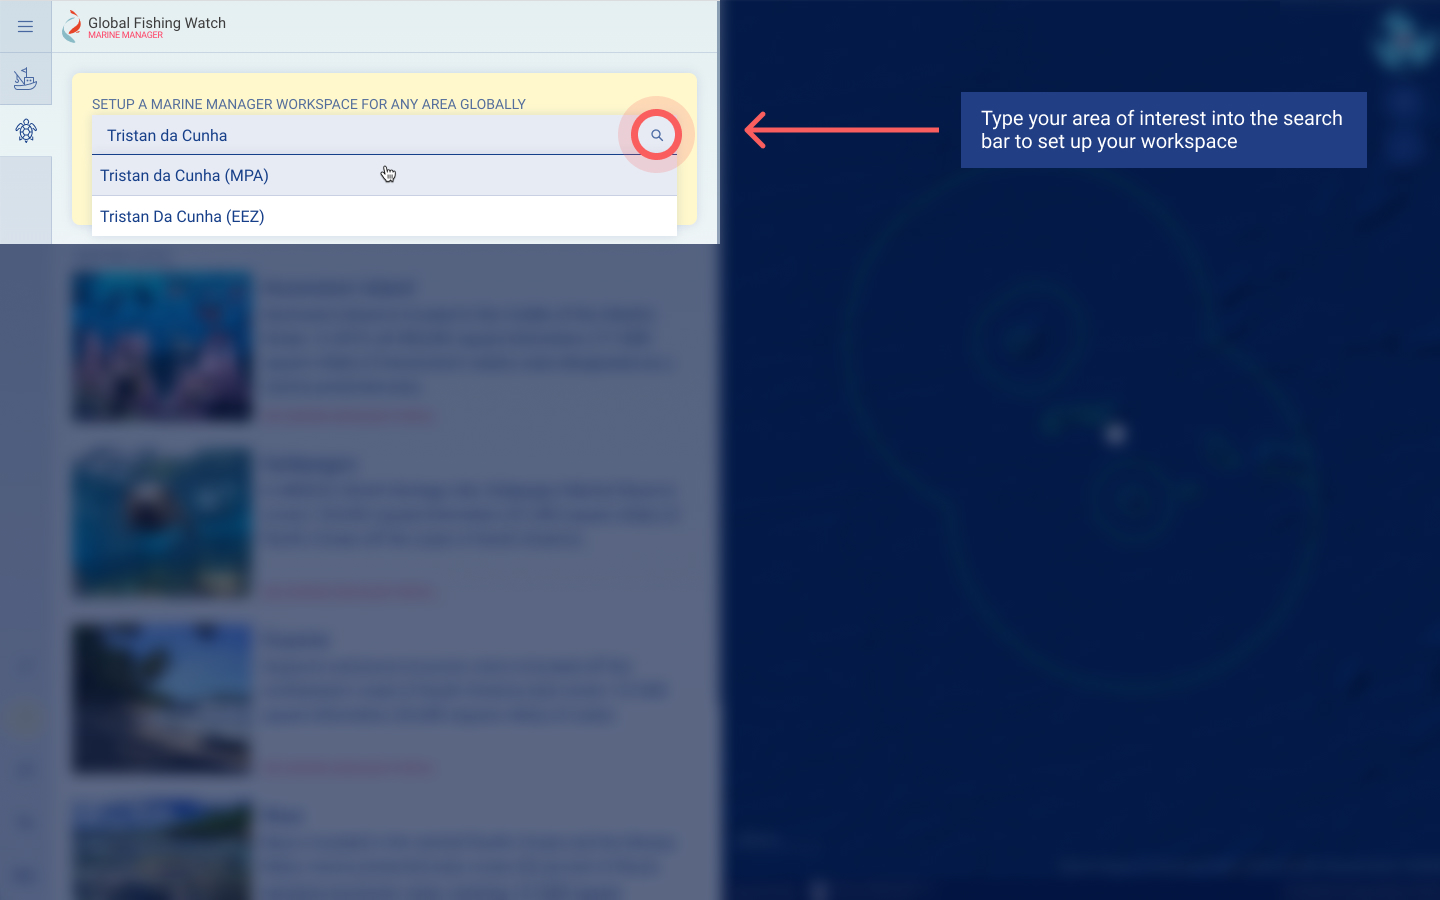
To set up a new workspace at any time, click on the turtle icon in the top left hand corner of the map. You must sign into your account to save your workspace.
Registered stakeholders can also upload static layers and time-series data to their workspaces, including animal tracks, and download data for advanced research techniques.
Learn more by watching this tutorial on setting up private workspaces in Global Fishing Watch Marine Manager.
The marine manager portal has a layer library of habitat and environmental layers. Access the layers via the layer library by clicking on the add icon beside the ENVIRONMENT section heading.
Habitat layers include:
- Coral reefs
- Mangroves
- Seagrasses
- Seamounts
Environmental layers include:
- Bathymetry
- Wave height
- Nitrate concentration
- Phosphate concentration
- Dissolved oxygen
- pH
For more information on each layer, click on the “i” icon beside each layer in the left sidebar.
To sort the order of the layers visible within the map, click on the order icon and drag and drop the layers in the desired order.
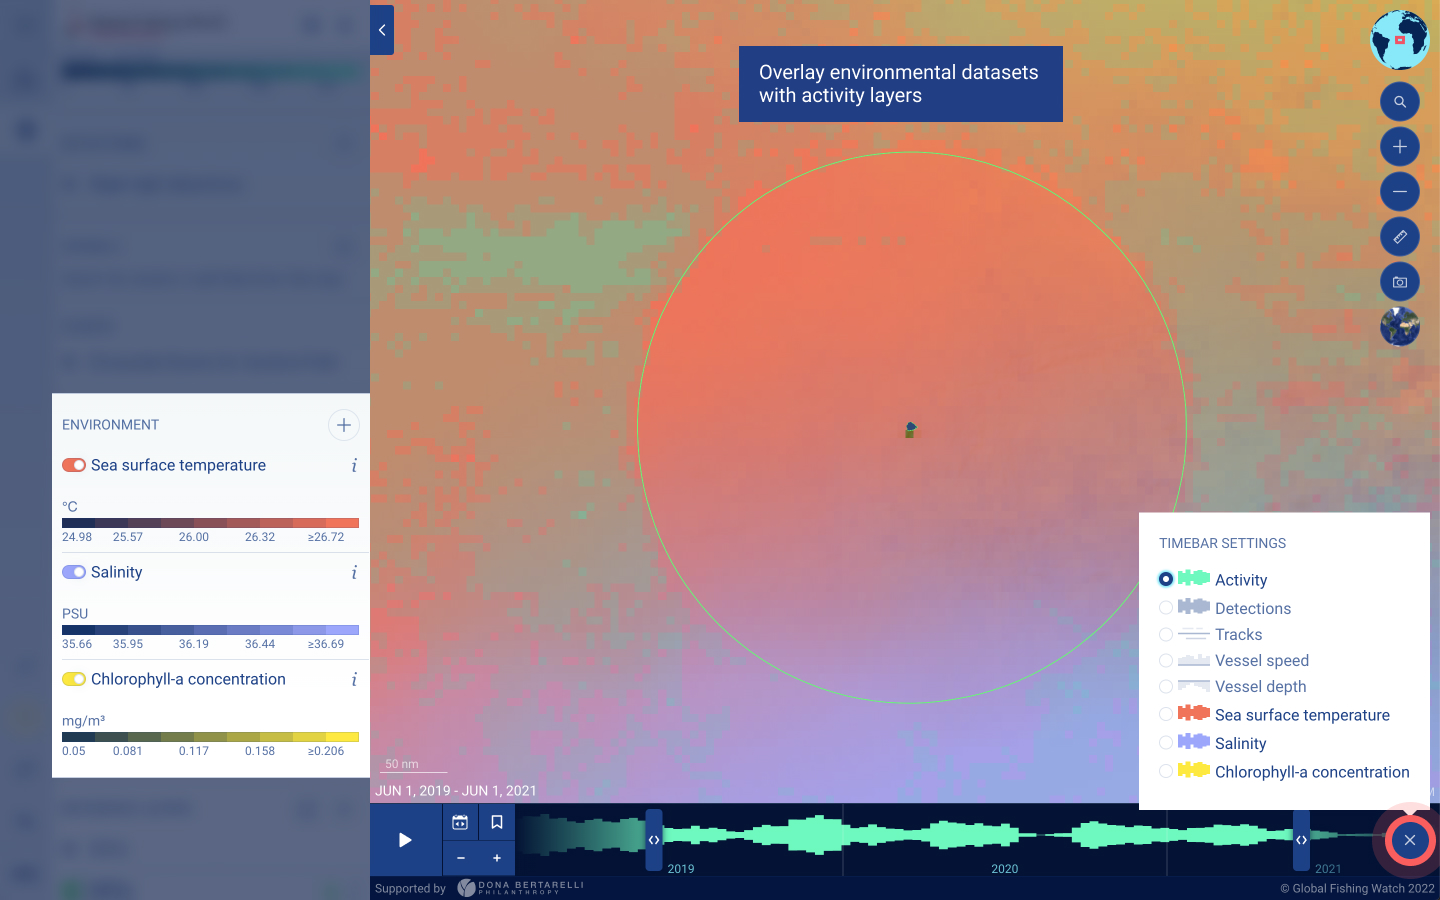
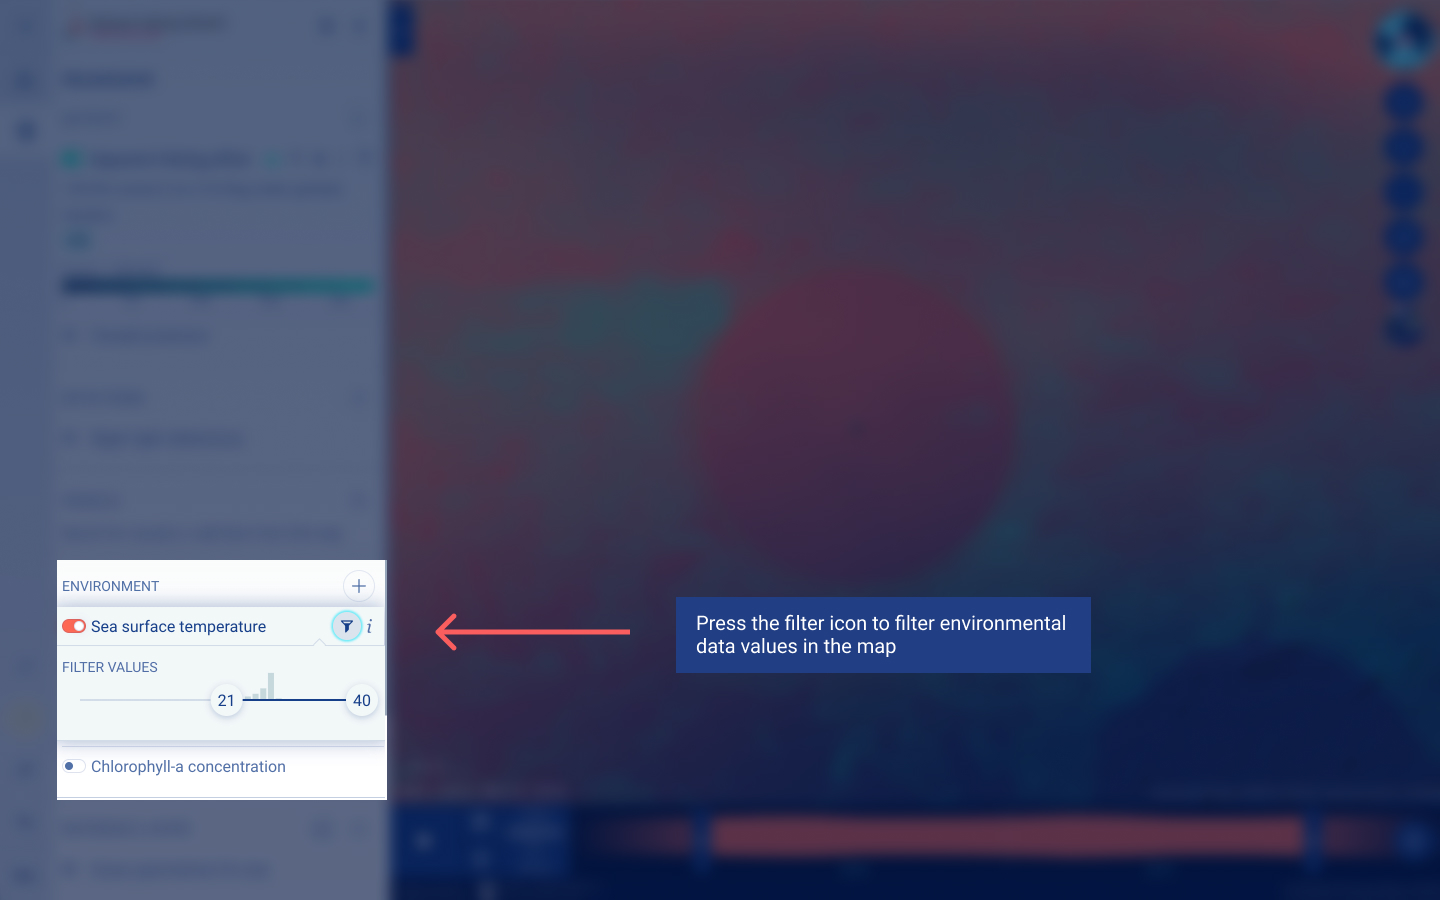
Each layer has environmental data at a monthly resolution. You can filter each environmental layer to only show the area where the environment data meets the range that you have set. This can be useful if species of interest only exist within a certain environmental parameter, such as specific temperature or salinity ranges. The filter includes a histogram, which highlights the frequency of environmental data values across the grid cells on your screen. You can also animate the data within the timebar to visualize how the area historically shifts across time.
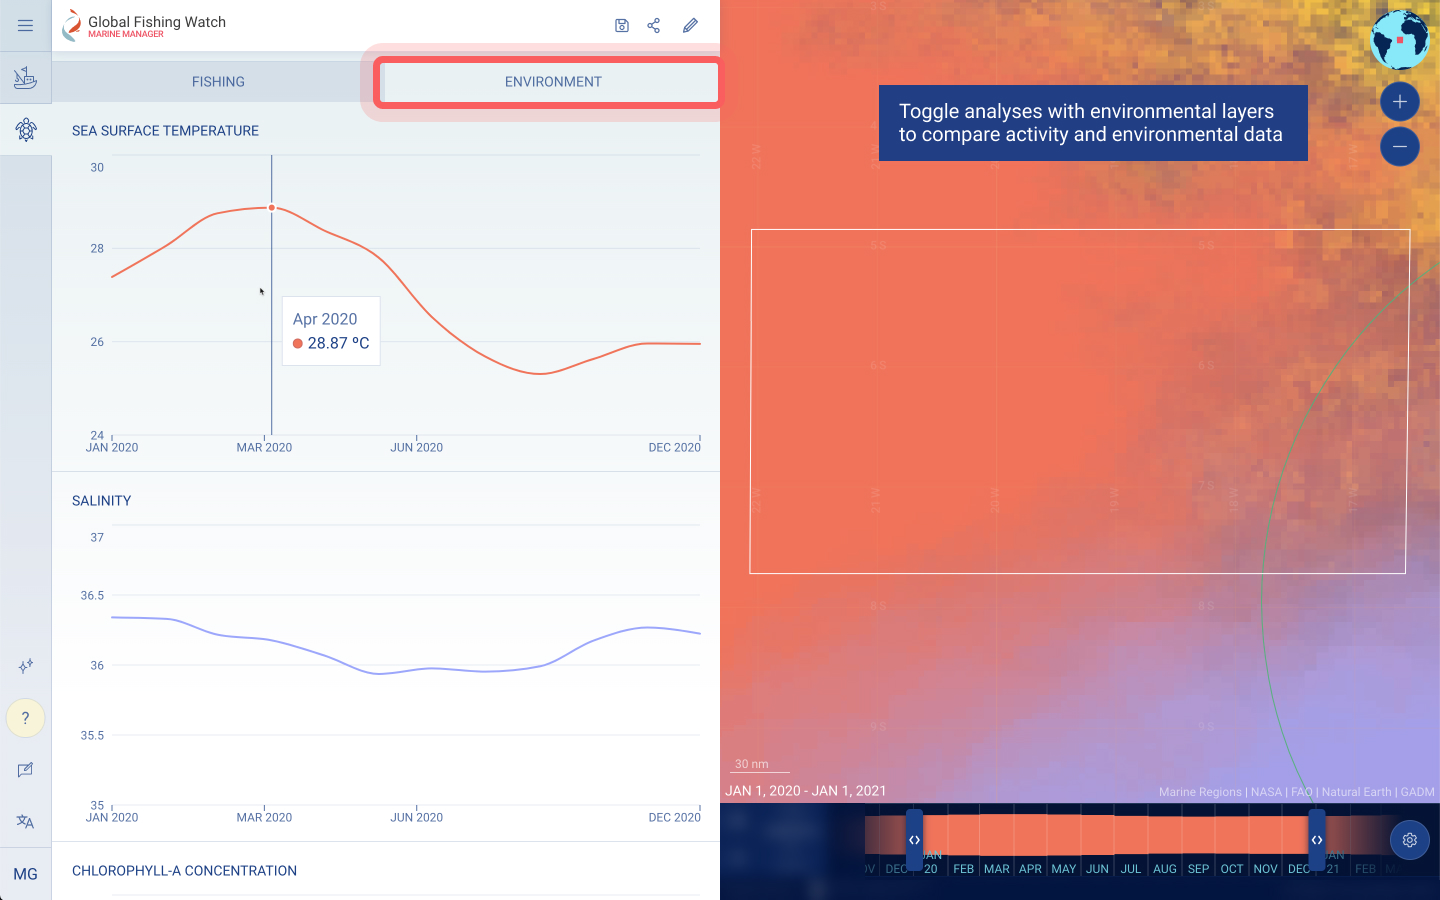
If an environmental layer is toggled on when you use the dynamic reports panel, you will be able to see how the environmental data changes over time for your area of interest.
Learn more by watching this tutorial on environmental layers in Global Fishing Watch Marine Manager.