Global Fishing Watch’s updated fishing data offers new insight into the presence and behavior of the global fishing fleet
In 2018, we published the first-ever global assessment of commercial fishing activity in Science. We tracked over 60,000 fishing vessels between 2012 and 2016, and estimated that fishing occurred on more than half of the ocean.
The paper sparked major media attention, and also attracted debate over our key finding and how to measure the global footprint of fishing — which in turn led to useful scientific discussions and further media coverage.
More importantly, the findings and data from this paper launched a large wave of research to better understand fishing in the world’s ocean. The paper has been cited more than 300 times and the data we released with it has been downloaded more than 6,000 times. This open-access data has opened the door for research with important ocean management implications, including papers showing that European marine protected areas may not actually be very protective, that sharks globally are at risk to fishing activity, and that much of high seas fishing may only be profitable due to large subsidies, among many others. Almost all of the subsequent papers published by the Global Fishing Watch research program have been built upon this dataset.
Since 2018, we have updated our models and continued to improve our technology, and we’re excited to release updated data that spans nine years, from 2012 through 2020. This dataset covers many more fishing vessels than our original dataset, mostly because many new vessels now have Automatic Identification System (AIS) tracking devices and broadcast their locations. As a result the measurable footprint of fishing has increased, with fishing being more widespread than in our initial data. As with the original dataset, though, this fishing activity, while widespread, is highly concentrated. Half of the fishing activity in our dataset occurs in just half a percent of the ocean, and three quarters occurs in just two and half percent of the ocean.
New data brings new knowledge
With our 2020 data, we can identify how the global fishing industry has been affected by COVID-19.
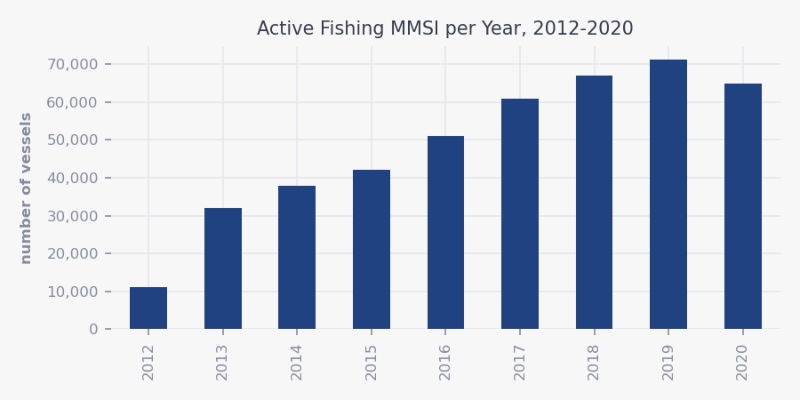
More generally, with the exception of a dip caused by COVID-19, we have seen an increase every year in the number of fishing vessels that broadcast the AIS, and, as a result, the amount of fishing activity has increased each year. In 2016, our dataset had about 50,000 active fishing vessels. In 2019, that number increased to over 70,000. Interestingly, it decreased by several thousand in 2020 due to COVID-19. Note that there are slight differences between these data and our 2016 data.
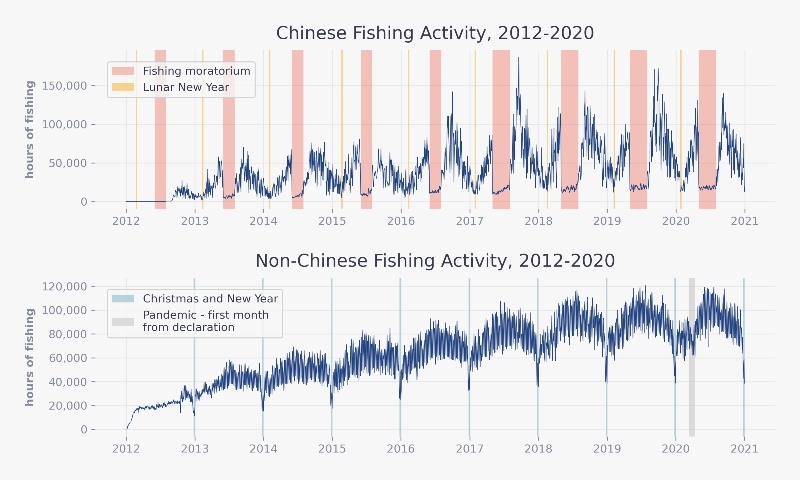
A key finding of our 2018 Science paper was that at a global scale, fishing was minimally affected by seasons but strongly affected by culture; the biggest drops in fishing activity by non-Chinese fishing vessels was for Christmas and the New Year, and the weekly pattern was far stronger than any other pattern, with fishers taking the weekend off. In China, the strongest signal was the Lunar New Year and a three month (now four months, as of 2017) moratorium on fishing during the summer months.
Have these trends continued? The answer is yes. We can now see the pattern across nine years of fishing.
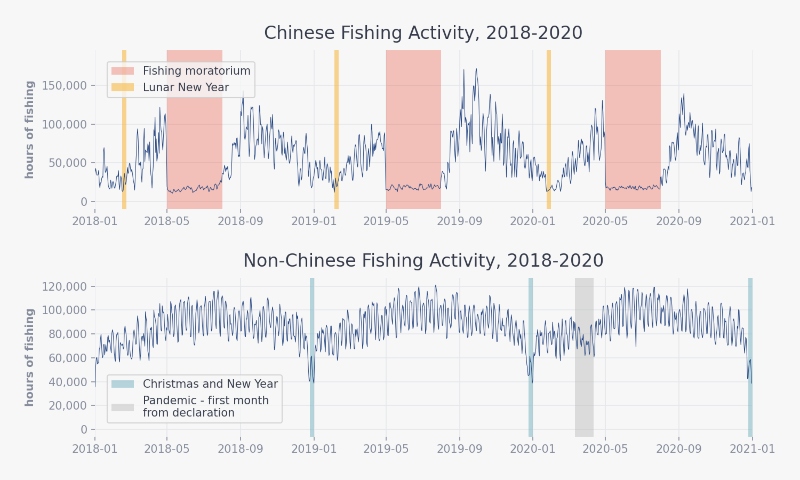
Zoom in to the past three years and you can see the pattern clearly. And in 2020, you can see a dip in March during the start of the pandemic for non-Chinese vessels. In China, where the pandemic began, it coincided with the Lunar New Year. The resulting lockdown made the Lunar New Year appear as if it were a month long in the data, with almost no fishing activity for several weeks.
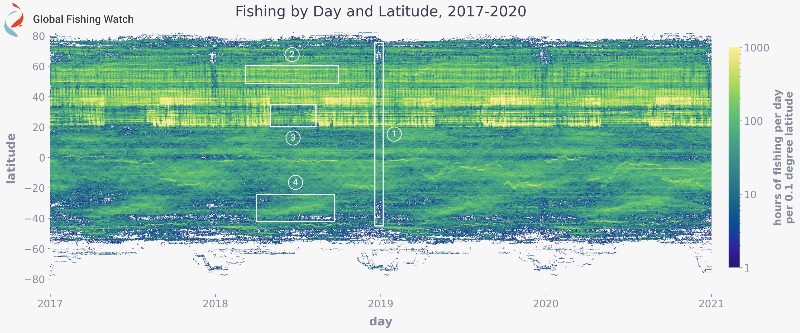
In our 2018 Science paper we also published a chart of fishing activity by latitude and day across a time series. We can now make this chart across nine years. Below, you can see gaps from Christmas and the New Year (both in the northern and southern hemisphere), and the gaps each year due to the Chinese moratorium.
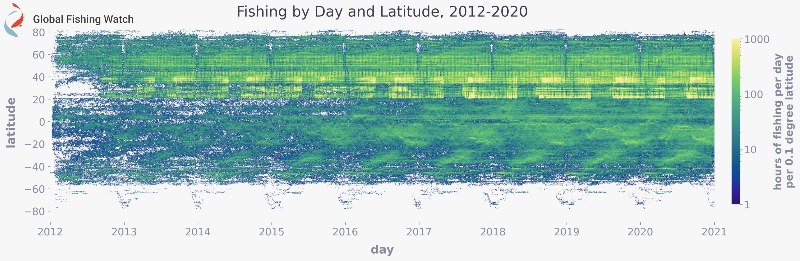
Zoom in for the past four years — 2017 to 2020 — to see in the figure below the years not covered by our original data release.
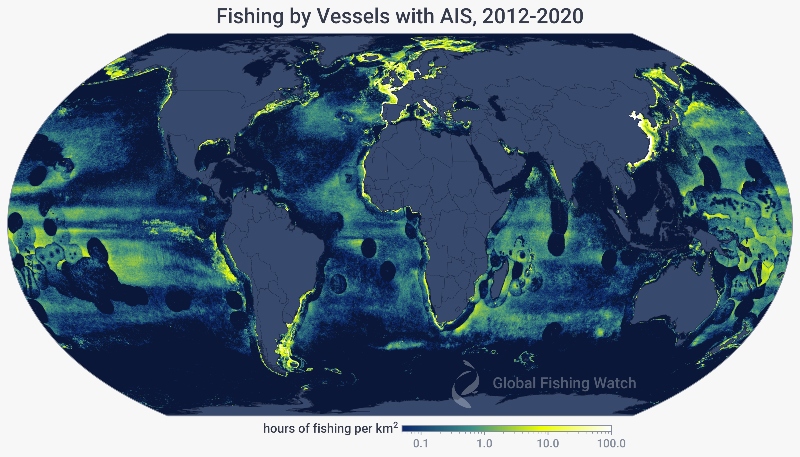
Our global map of fishing now has more activity and covers more vessels, as we explained in the Global Atlas of AIS Fishing. The map below shows fishing activity across all nine years of our dataset.
How much of the ocean is “fished”?
In our 2018 paper, we estimated that when dividing the world into a grid about half a degree wide at the equator, or squares that are just over 30 miles on a side, about just over half of the ocean had fishing activity. Our new dataset, which is more restrictive on fishing activity—that is, we are more careful to exclude activity which might not be fishing—reduces this figure to just under 50 percent for 2016. But for 2020, the number is over 55 percent, and across all years in our data (2012-2020), the number is even higher.
However, this fishing activity, while widespread, is also highly concentrated. Half of the fishing activity in our dataset occurs in just half a percent of the ocean, and three quarters occurs in just two and half percent of the ocean. This incredible concentration reflects the fact that fish are also highly concentrated in the ocean, mostly living along the edges of the continents. In summary, fishing is both concentrated and disperse; most of the fishing activity happens in just a few places close to the continents’ edges, but at the same time, most parts of the ocean are visited by a fishing vessel at some point in the year.
It’s exciting to draw upon billions of GPS positions to map almost a decade of human activity across the world ocean. Our work, though, is just beginning. Although our data includes most fishing vessels larger than 24 meters and the majority of the world’s high seas fishing activity, it excludes vessels that don’t publicly broadcast their movements, including tens of thousands of industrial vessels and hundreds of thousands of smaller, artisanal vessels. We are now working on techniques to track these vessels, and believe that in the coming years, we will be able to monitor more and more of human activity at sea.
David Kroodsma is the director of research and innovation at Global Fishing Watch.