One year into the pandemic that triggered turmoil around the world, an analysis of Global Fishing Watch data sheds light on shifts in global fishing activity
As the world marks the March 11th anniversary of the World Health Organization’s declaration of the COVID-19 pandemic, the fishing sector—like many industries—continues to feel the effects. With our recently updated fishing data, we can now estimate the scale of these impacts across all of 2020 and identify some of the regions hit hardest by the pandemic. Our preliminary analysis points to an unprecedented global decline in fishing activity, with particularly dramatic declines in Europe and China.
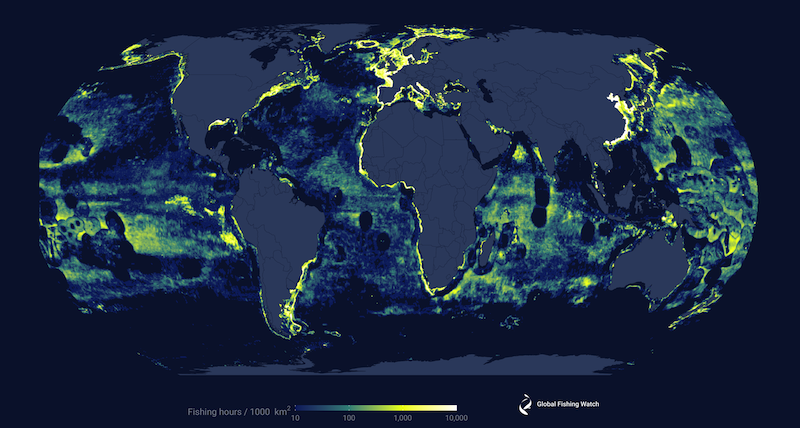
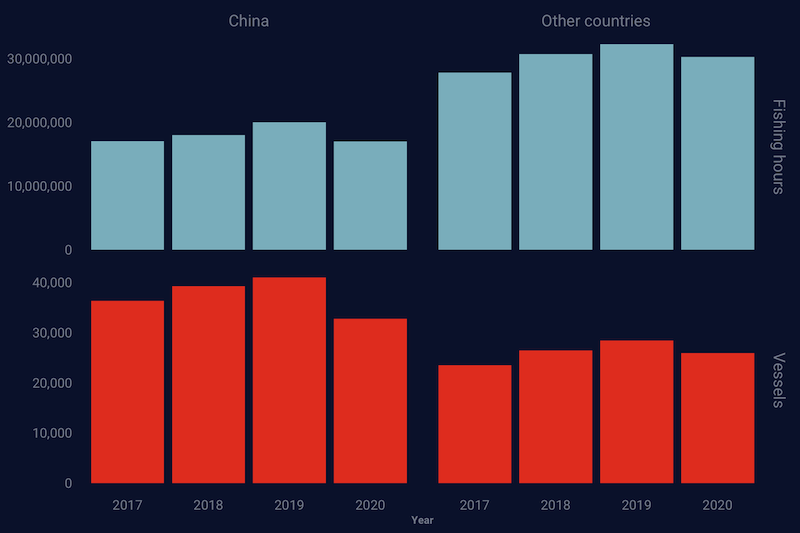
According to our tracking data, approximately 63,000 vessels collectively fished for over 50 million hours in 2020 (Figure 1). When compared to 2019, these numbers represent a 9 percent decrease in the number of active fishing vessels and a 5 percent decrease in the hours of fishing. This decrease, though, is likely a significant underestimate of the actual decline in fishing activity.
We believe these numbers are an undercount because in a normal year, fishing activity in our data should have increased over the previous year. We measure fishing activity by monitoring the movements of fishing vessels that broadcast their GPS positions via the automatic identification system (AIS). Each year before 2020, both the number of fishing vessels and amount of fishing activity in the Global Fishing Watch dataset have increased, as more vessels have acquired AIS, largely due to changing regulations. For instance, in 2016, the United States required AIS devices on all vessels longer than 65 feet, and as a result, the number of U.S. vessels in our database increased substantially. Because of this adoption of AIS, between 2013 and 2019, the number of fishing vessels in our database increased by an average of 14 percent per year and the number of fishing hours increased by an average of 16 percent per year. Given this expected increase, the decline in activity in 2020 is even more striking. Although many new vessels did acquire AIS—for instance, we see a big increase in Indonesian vessels with AIS in 2020—these increases were offset by more significant decreases in activity elsewhere.
We can’t be sure, however, how the global pandemic affected the number of fishing vessels that would have been added to our database in 2020, so we are unable to determine exactly how much fishing decreased. To compare 2020 to previous years and identify which fleets and regions saw the biggest changes, we thus excluded all vessels that became newly active in 2020 from our analysis. All of the following analyses in this blog post exclude these new vessels and compare activity with the average of 2018 and 2019 fishing activity. While this analysis provides an imperfect comparison, it provides a first estimate of how industrial fishing activity was different in 2020 than previous years.
Spotlight on China’s fishing fleet
More than half of all the fishing vessels in our AIS data are flagged to China—a fleet so large it can dominate global trends. Changes in fishing activity during 2020 show that much of the overall decline can be attributed to the Chinese fleet, which saw 18.4 percent fewer active fishing vessels and 10.7 percent fewer fishing hours in 2020 relative to 2018-2019. Among the rest of the world’s fishing nations, active vessels and fishing hours declined to a lesser degree, 5.4 percent and 4 percent respectively (Figure 2).
Fishing changes by region, 2020
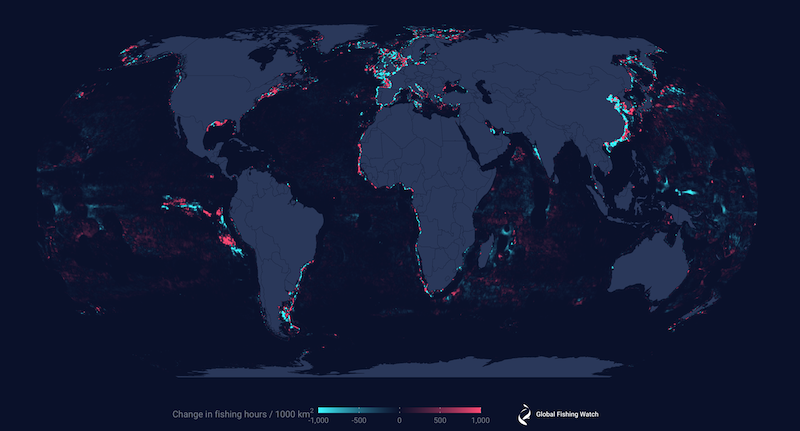
By examining our 2020 map of fishing activity, and comparing it with previous years, we can start to reveal where fishing effort may have been most impacted by COVID-19 restrictions. We observe a clear decline in fishing activity in much of Europe, China, Argentina, and India, as well as in the high seas pockets of the western Pacific. Surprisingly, increases in activity are seen along the Gulf and Atlantic coasts of the U.S., northwest Africa, off the coasts of South Korea and Japan, and in the central Indian Ocean. The northward shift observed off Peru likely represents interannual variation in the squid fishing grounds, as the fleets fish in slightly different locations each year. The high seas of the Atlantic appear to be one of the least affected fishing grounds (Figure 3).
As countries came under the grip of COVID-19 in early 2020, many of the world’s largest fishing nations saw dramatic and sustained declines in fishing activity (Figure 4). China and the United Kingdom saw the largest decline in fishing activity within their exclusive economic zones (EEZs), with decreases of about 2 million (down 13.5 percent) and 368,000 fishing hours (down 16.5 percent) respectively. In contrast, the U.S., South Korea, and Japan each saw more than a 15 percent increase in fishing hours. Interestingly, despite the increase in fishing activity, all three countries had fewer active fishing vessels in 2020 than the prior two years. While it is beyond the scope of this analysis to determine to what extent COVID-19 is responsible for the observed changes, the timing of changes in activity throughout the year certainly suggests a strong link, with many countries experiencing extended reductions in fishing activity shortly after the March 11th pandemic declaration (Figure 4).
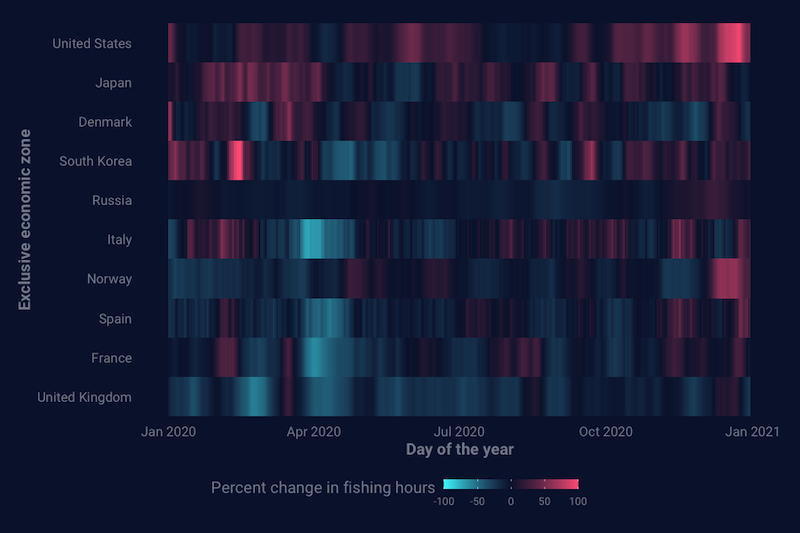
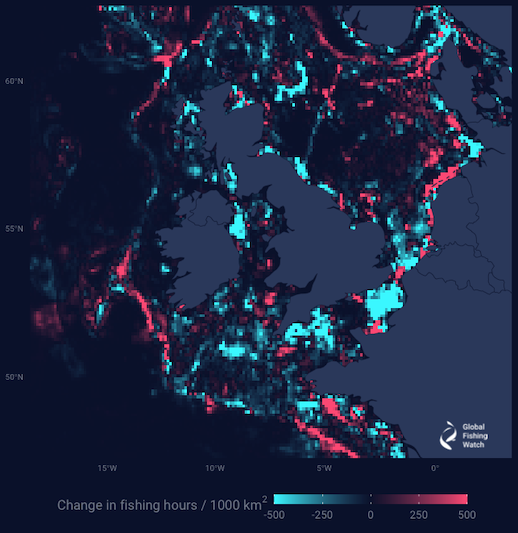
Many of the world’s top fishing nations saw significant and sustained reductions in fishing activity in March and April of 2020, as countries implemented national lockdowns, market closures, and other policies to combat COVID-19 (Figure 4). In some places, such as the U.S. and Japan, initial declines in activity appear to have been less pronounced and shorter lived. In South Korea, activity spiked in February, perhaps in response to reduced activity by the Chinese fleet, before experiencing an extended period of lower activity similar to other countries. For others, in particular many of the European countries, fishing activity remained depressed for extended periods (Figure 4). Looking closer at the activity around the United Kingdom shows the decreased activity was distributed, with large declines throughout the English Channel and Irish Sea (Figure 5).
Open data can advance research into COVID-19 impacts
Our preliminary analysis of potential COVID-19 impacts on global fishing activity demonstrates the power and potential of our public fishing effort data. It’s now clear that global fishing activity contracted during the pandemic, and that the magnitude of this disruption varied across the world, with the strongest declines in China and Europe. Satellite vessel tracking data can help us better understand changes like these in the behavior of the global fishing fleet and inform management responses. We remain committed to sharing our data openly and for free to further research and better understand how the pandemic is impacting fishing activity across our global ocean.
Tyler Clavelle is a data scientist at Global Fishing Watch.