
 Related expert:
 The global squid fishery is made up of hundreds of vessels operating primarily in unregulated areas of the high seas. In recent years, fishing activity has increased sharply, raising concerns in coastal States whose exclusive economic zones (EEZ) border major squid fishing grounds.
The global squid fleet comprises both local coastal fishers and industrial distant-water vessels. A significant portion of this fleet fishes exclusively at night, using an array of bright lights to lure squid toward the surface, where they are snagged with barbed lures and hauled on board.
These lights are so intense that they are visible in images of Earth taken from space. But despite that luminescence and the high volume of fishing, many of these vessels operate in the dark due to limited regulation of the international squid fishery.
Global Fishing Watch harnesses cutting-edge technology to analyze squid fishing activity, supporting monitoring, control and surveillance efforts. By revealing the true scale and behavior of these fleets, Global Fishing Watch provides governments and regional fisheries management organizations with the evidence needed to design stronger, science-based measures for a sustainable fishery.
Revealing the true scope of squid fishing worldwide
Today, the global squid fishery is a vast, highly mobile enterprise that spans Earth’s ocean. And yet, much of it remains outside effective oversight. According to the 2023 Global Fishing Watch study, “Fishing Through the Cracks: The Unregulated Nature of Global Squid Fisheries,” squid-fishing vessels logged between 149,000-251,000 vessel-days annually from 2017-2020, marking a 68 percent increase in fishing effort in just three years. Alarmingly, up to 86 percent of that global squid fishing occurs in unregulated waters which mostly lack regional or national management.
By combining automatic identifcation system (AIS) vessel tracking data with satellite imagery of nighttime fishing lights, Global Fishing Watch mapped the squid fishery’s full global footprint and uncovered striking patterns. Squid fleets move rapidly between oceans, often within a single year, and tend to concentrate in unregulated areas such as the northwest Indian Ocean, the Southeast Pacific and the Southwest Atlantic.
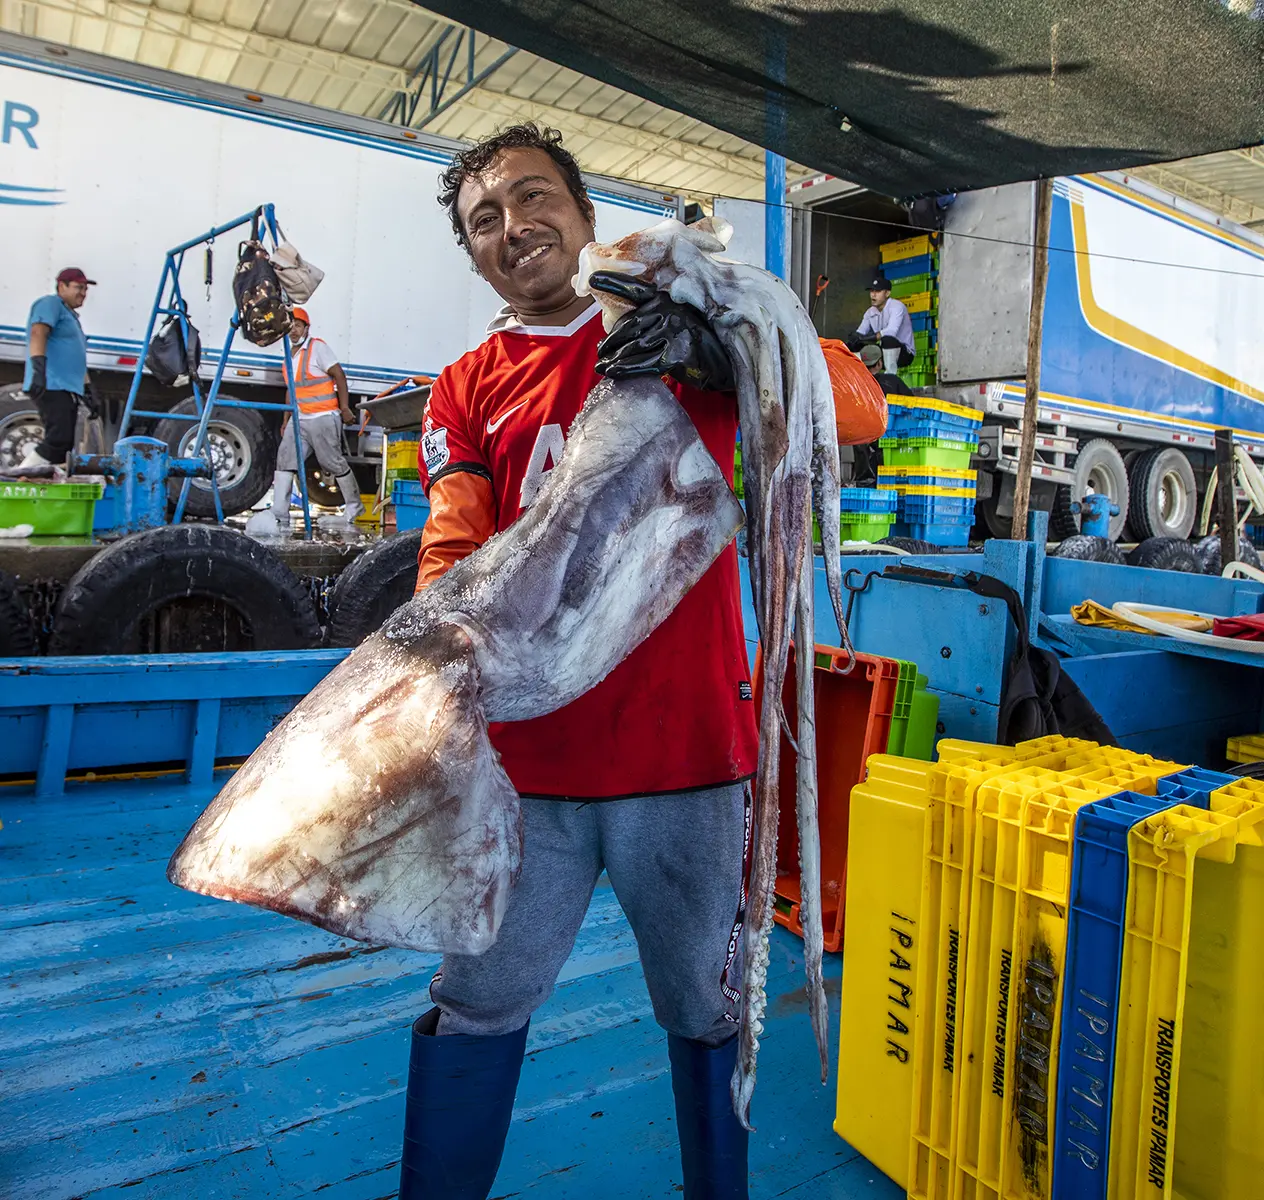
Squid fishing is also vital for artisanal and small-scale fishers, particularly in Peru, where tens of thousands depend on the fishery for their livelihoods.
In several regions, vessel activity has tripled or quadrupled in just a few years, while fishing pressure in regulated waters has remained relatively stable. This pattern suggests fleets may be shifting toward governance gaps where oversight is weakest.
These findings underscore the pressing need for coordinated international management, as squid are key species in marine food webs and are vital to the livelihoods of coastal communities. Without improved transparency, monitoring and cross-boundary regulations, growing fishing pressure threatens both ecological stability and economic security.
Jumbo squid fishery in the Southeast Pacific Ocean
The jumbo squid (Dosidicus gigas) is the most abundant cephalopod species in the Southeast Pacific Ocean, ranging from the North American coast to southern Chile. This elusive species can grow up to 9.8 feet long (3 meters) and weigh as much as 110 pounds (50 kilograms).
Sustainable management of jumbo squid depends on effective monitoring. Greater transparency in vessel activity helps inform fair fishing policies, strengthens oversight and exposes potential risks of noncompliance. To support this effort, Global Fishing Watch has been analyzing the behavior of distant-water fleets operating off the coast of South America, shedding new light on the true scale of fishing in the region.
Analysis area
Explore this activity through Global Fishing Watch’s jumbo squid workspace or dive deeper into the data and learn how to track vessels step-by-step.

A screenshot from the Global Fishing Watch map shows the analysis-area polygon used to assess squid fleet activity from 2021- 2025.
Key jumbo squid fishery figures
Review the key indicators of activity by the distant-water squid fleet operating in the Southeast Pacific. The figures below summarize trends in fleet size, fishing effort, transshipment activity and port visits over time, offering insight into how industrial squid fishing has evolved across the region.
| 2021 | 2022 | 2023 | 2024 | 2025 | |
|---|---|---|---|---|---|
| Number of vessels |
495 fishing vessels 167 carrier vessels |
469 fishing vessels 176 carrier vessels |
515 fishing vessels 176 carrier vessels |
545 fishing vessels 143 carrier vessels |
628 fishing vessels 158 carrier vessels |
| Fishing days | ~93,935 | ~122,851 | ~104,074 | ~125,908 | ~106,001 |
| Carrier vessel encounter events | 2,410 | 3,134 | 4,214 | 2,088 | 3,313 |
| Port visits by fishing vessels to Latam ports |
232 Mostly Punta Arenas (CHI) and Callao (PER) |
79 Mostly Punta Arenas (CHI) and Callao (PER) |
315 Mostly Punta Arenas (CHI) and Callao (PER) |
272 Mostly Callao and Pisco (PER) and Punta Arenas (CHI) |
321 Mostly Iquique, Punta Arenas and Arica (CHI) |
| Closest distance from Galápagos EEZ | 215 nautical miles | 158 nautical miles | 243 nautical miles | 210 nautical miles | 215 nautical miles |
Figures reflect Chinese-flagged fishing and other flagged carrier vessels present in the analysis area each year, detected using AIS vessel tracking data and VIIRS satellite imagery. We calculated the closest distance to the Galápagos EEZ by taking each vessel’s closest location during the year when operated for at least 24 hours near that EEZ.
The story of jumbo squid

Transparency can help create a more accurate global picture of apparent fishing effort, supporting scientific research on stock health and distribution. With the right information, science can advance more quickly — helping inform fairer, smarter policies that protect fisheries and the communities that depend on them.