







The ocean has long been a blind spot for even the most talented geospatial analysts. While land-based data is often just a click away, the ocean and the various activities taking place across it have historically been locked behind massive datasets, complex application programming interfaces and the need for custom coding.
For government analysts, researchers and marine managers — those who rely on Esri ArcGIS every day — the struggle to integrate open-source ocean data into existing workflows has been a significant barrier to action.
That barrier is now gone.
To coincide with the 2026 Esri FedGIS conference, Global Fishing Watch released 13 of its most-used ocean activity datasets as ready-to-use map functions directly within ArcGIS Online. No downloads, no scripts and no manual data wrangling — just ocean data integrated into the tools already being used.
Here are five ways this integration allows you to explore the ocean like never before.
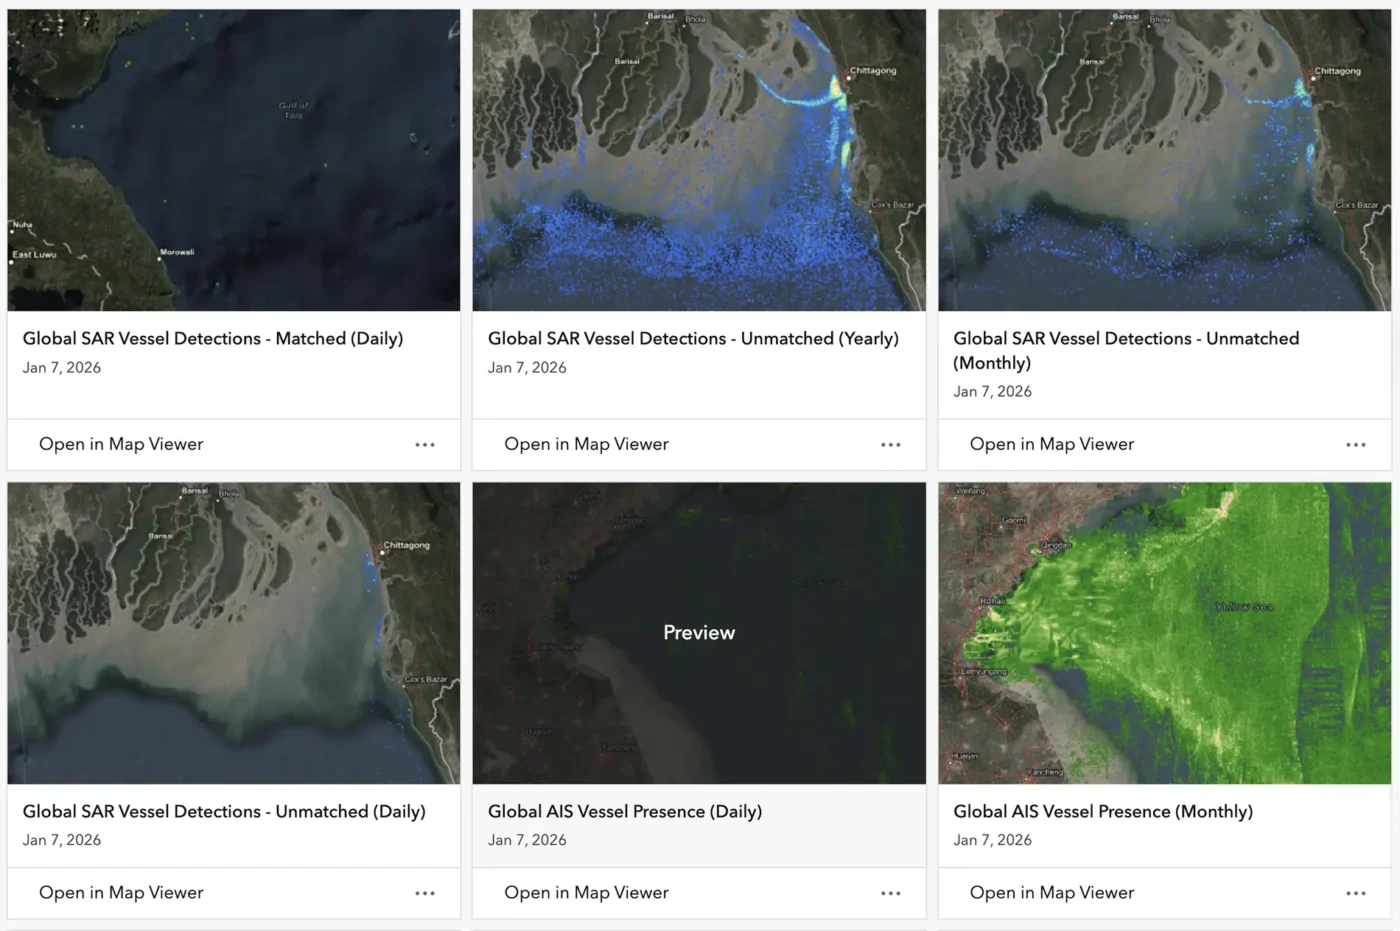
Not all vessels want to be found. While automatic identification systems, or AIS, can provide a wealth of data about a vessel’s whereabouts, ships can go “dark” by turning off their transponders. And in other cases, limitations in technology or policy may be the reason as to why these ships don’t appear in public monitoring systems. By accessing our synthetic aperture radar (SAR) layers, specifically the “unmatched” detections, users can now see where radar has spotted a vessel that isn’t broadcasting its position. Having the ability to overlay this information in ArcGIS Online offers a fuller picture of potential unreported activity — a critical tool for fisheries management and enforcement.
Understanding the human footprint on the ocean requires looking at more than just a snapshot in time. We’ve provided daily, monthly and annual layers to help users visualize long-term shifts. Through the native ArcGIS time slider, users can animate the pulse of the global fleet and watch how fishing intensity shifts by season or how vessel presence evolves year-over-year in response to management decisions or climate change, without ever having to manually integrate separate files.
The true power of this integration lies in context. Users can now pull Global Fishing Watch’s global fishing effort or vessel presence layers directly into maps alongside their own local or regional data — such as exclusive economic zones, marine protected areas or sensitive habitat maps. This allows for instantaneous, high-level comparisons that were previously prone to error when stitching multiple sources together.
The ocean is no longer just for transit; it’s an industrial workplace. Our fixed infrastructure vector layers identify oil platforms, wind turbines and other stationary structures. This means users now have the ability to instantly visualize how the expansion of offshore industry intersects with migratory routes or fishing grounds, supporting more informed environmental impact assessments, management decisions and overall marine planning.
Transparency only works when everyone is looking at the same map. Because these layers are hosted and publicly available for noncommercial use, government agencies, researchers and nongovernmental organizations can now work from a single, reliable source. This eliminates versioning conflicts and allows teams to co-develop dashboards and reports that reference the same datasets, fostering the kind of cross-agency collaboration needed to meet global goals like the 30×30 target.
For years, the feedback from our community was clear: We love Global Fishing Watch data, but we don’t have the technical expertise to pull it from your API. This release is our answer.
By extending our open data infrastructure into a hosted, user-friendly environment, we are quickly putting high-quality ocean insights into the hands of more people, equipping them with the necessary tools to respond faster to emerging threats and support evidence-based stewardship of our marine resources.
Yaa Kusi-Fordjour is a product manager at Global Fishing Watch.
We use cookies to keep our site running smoothly and to understand how you interact with us. Allowing cookies helps us give you the best, personalized experience. If you opt out, some parts of the site might not work as beautifully as they should.
Take a quick website survey to help us build a better experience for visitors like you.