
Major Data Update: Improvements and FAQ
Overview
Data improvements and technical upgrades
Impact on data and user experience
Will apparent fishing activity estimations change in some places with this release?
What improvements will users see in vessel classifications?
Why do some vessels now appear under a broader gear type?
Can users compare pre- and post-update data?
How to compare the new and previous data in the platform?
How to compare the new and previous data using public APIs?
Are there any known limitations or caveats with this data release?
Understanding changes to historical data
Overview
What is included in the new data release?
On Oct. 21, 2026, Global Fishing Watch launched a major upgrade to its core AI models and data processing infrastructure. The release provides daily, globally updated estimates for fishing activity, vessel classification and thousands of new anchorages — spanning our full historical record from 2012 to present. These improvements are automatically reflected across our public map, API portal and downloadable datasets, setting the global standard for ocean intelligence.
Why is Global Fishing Watch introducing this data release?
This update marks the first major structural AI upgrade to the organization’s core fishing and vessel classification models since its founding. By replacing legacy systems with state-of-the-art machine learning, the release resolves longstanding, user-reported discrepancies and sets a higher standard for global ocean intelligence.
Is the website or map interface changing?
No. The public map, user interface, tools and overall site design remain unchanged. All improvements are strictly “under the hood” within our data processing layers and machine learning models.
What dataset names changed and why?
We have renamed two of our datasets: “Apparent fishing effort” is now apparent fishing activity, and “fishing events” are now apparent fishing events.
Governments, researchers and analysts use Global Fishing Watch datasets daily to monitor where fishing is happening across the ocean. As that use has grown, feedback from data users revealed that the former names could suggest a narrower or more exact interpretation than the datasets are built to provide. The new names more accurately describe what the data actually show.
“Effort” is the clearest example. In fisheries science, “fishing effort” has a specific technical meaning, such as the number of hooks a vessel sets or the area a net sweeps. Our datasets measure something different: an estimate of when and where vessels were likely fishing, based on a model that analyses their movements. “Activity” describes this more accurately without implying the gear-specific measurements we do not currently provide. Learn more about our data processing.
The same principle applies to “fishing events”. Each event is a grouping of consecutive positions our model identified as probable fishing, designed to make a vessel’s track clearer and easier to analyze. However, some users may interpret “event” as a confirmed instance of fishing. Adding “apparent” keeps the naming consistent across our data and reinforces that these are strong inferences, not direct observations.
Precise terminology helps users apply these datasets appropriately and communicate with confidence what the model reveals and what it does not.
We have updated these names across the map, the website, our help articles and dataset documentation. Our API dataset will retain “effort” until version 6 to ensure existing code and links continue to work.
Please reach out at [email protected] if you have any questions.
Data improvements and technical upgrades
How do the upgraded AI models work?
The updated models analyze vessel movement patterns alongside information broadcast through the automatic identification system, or AIS, to determine a vessel’s primary function — such as fishing, cargo, passenger or another vessel type — with greater precision.
This improved analysis has allowed thousands of vessels to be more accurately classified into fishing and non-fishing categories. The identification of gear and drifting buoys in the water, previously a longstanding source of false positives for vessels, has also substantially improved.
What new baseline geographic data is included?
- 5,300+ new anchorages: Integrated across 13 countries to refine distance-to-port calculations and eliminate false port visits. The 13 countries are Brazil, Chile, Costa Rica, Ecuador, Indonesia, Kenya, Montenegro, Nicaragua, Panama, Papua New Guinea, the Philippines, El Salvador and Vietnam.
- Unified spatial grid: Standardizes distance-to-shore, distance-to-port and ocean-depth measurements into a single grid to eliminate mapping glitches.
- High-resolution bathymetry: Incorporates an updated external depth source (ETOPO 2022) for higher-resolution ocean floor estimates globally.
- Updated regional layers: Pre-loads FAO Major Fishing Areas for Statistical Purposes, General Fisheries Commission for the Mediterranean Fisheries Restricted Areas, and ProtectedSeas Marine Managed Areas/Navigator database directly into the platform.
Impact on data and user experience
Will apparent fishing activity estimations change in some places with this release?
Yes. Global estimates of apparent fishing activity may decrease in some regions in both AIS-based and national VMS-based data. This does not necessarily indicate a real-world decline in fishing activity. Instead, it reflects the removal of false positives such as low-speed vessel movements in ports, transit activity and coastal maneuvering, that the previous model incorrectly classified as possible fishing.
Overall, historical AIS data for fishing vessels decreased by 3.55 percent, with around 7 percent reduction over the past two years. These percentages vary considerably depending on vessel type and geographical region. Notably, non-fishing vessels likely experienced a much greater drop due to targeted efforts to strip out false positives.
VMS data saw a considerably sharper decline. Historical data across all countries for fishing vessels dropped by approximately 30 percent. For further details, see the update documentation.
Who’s who at sea
Our updated model significantly improves vessel classification accuracy, correctly reclassifying non-fishing and fishing activity. Any apparent fishing events linked to misflagged vessels have been removed to deliver a clearer, more accurate map.
Drag the slider to see how the new model refines activity data across the map.
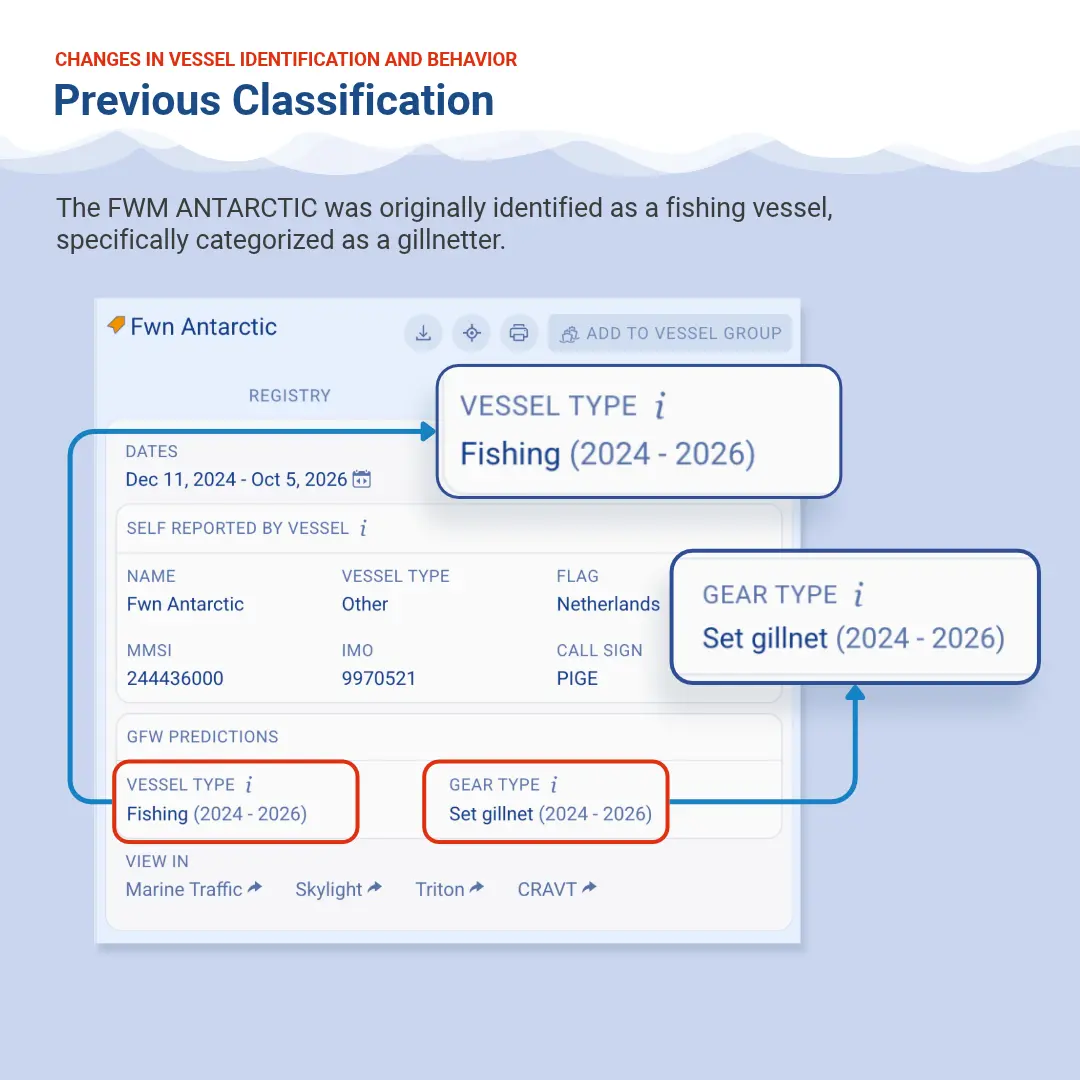
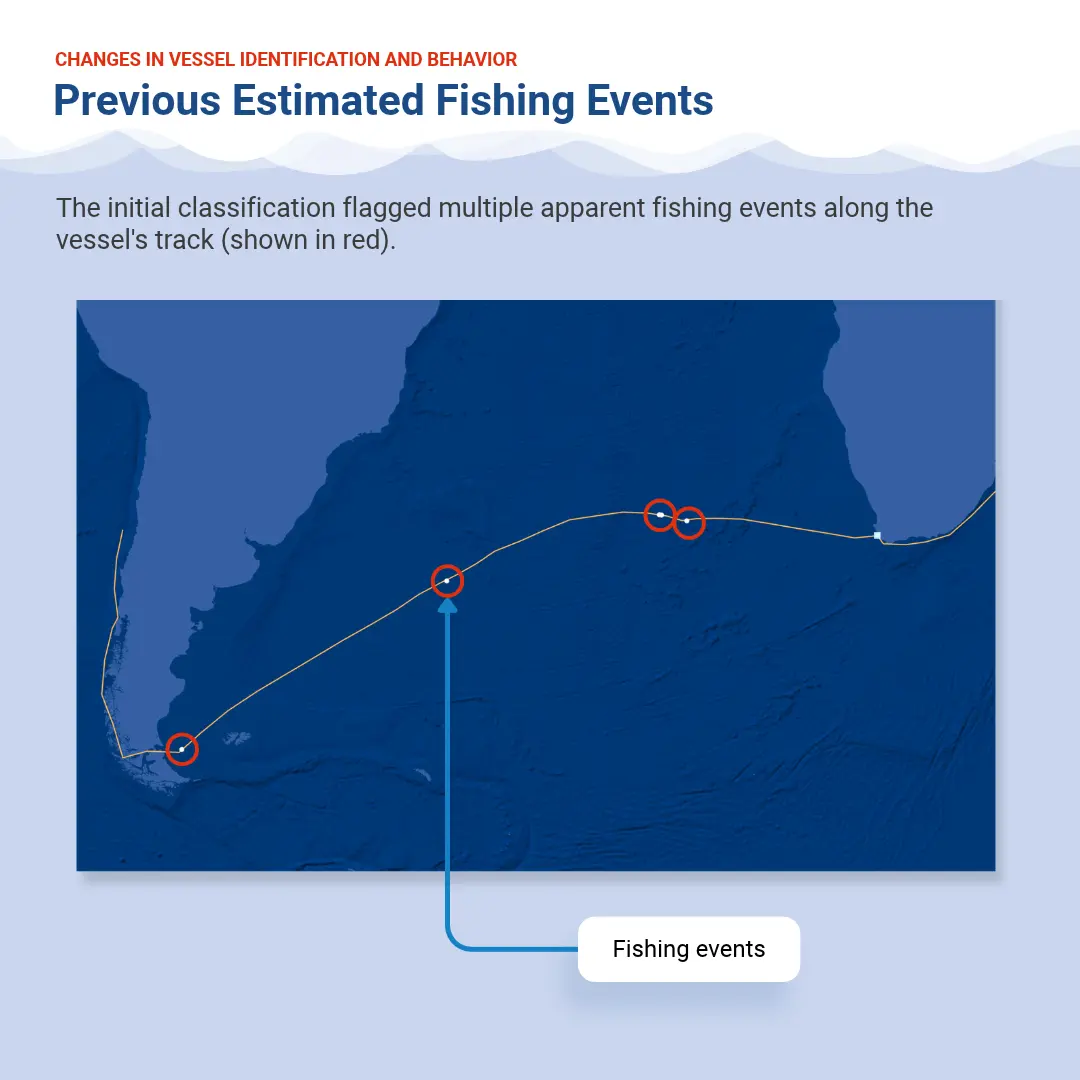
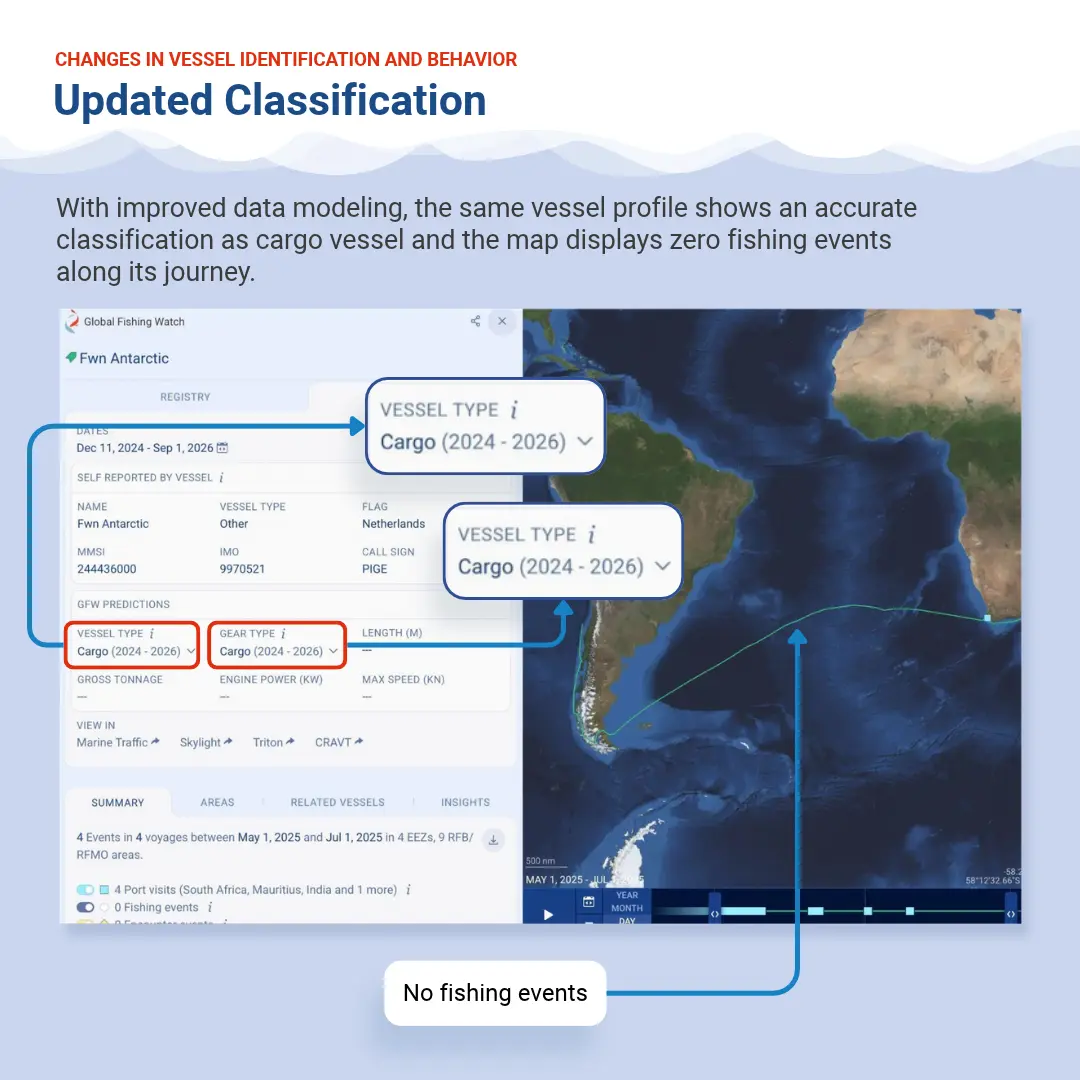
Smarter profiles ensure non-fishing vessels, such as cargo vessels, are more accurately represented on the map.
© 2026 Global Fishing Watch.
What improvements will users see in vessel classifications?
- Fewer unknowns: Thousands of previously unclassified or “other” vessels are now categorized into specific fishing and non-fishing classes using self-reported AIS data and track behavior.
- Buoy and gear filtering: Improved logic prevents drift buoys and fishing gear from being misclassified as actual fishing vessels.
- Weak-signal recovery: Static AIS data allows the model to classify vessels even when satellite tracks are broken or incomplete, such as in heavily congested waters like the South China Sea.
Same waters, sharper lens
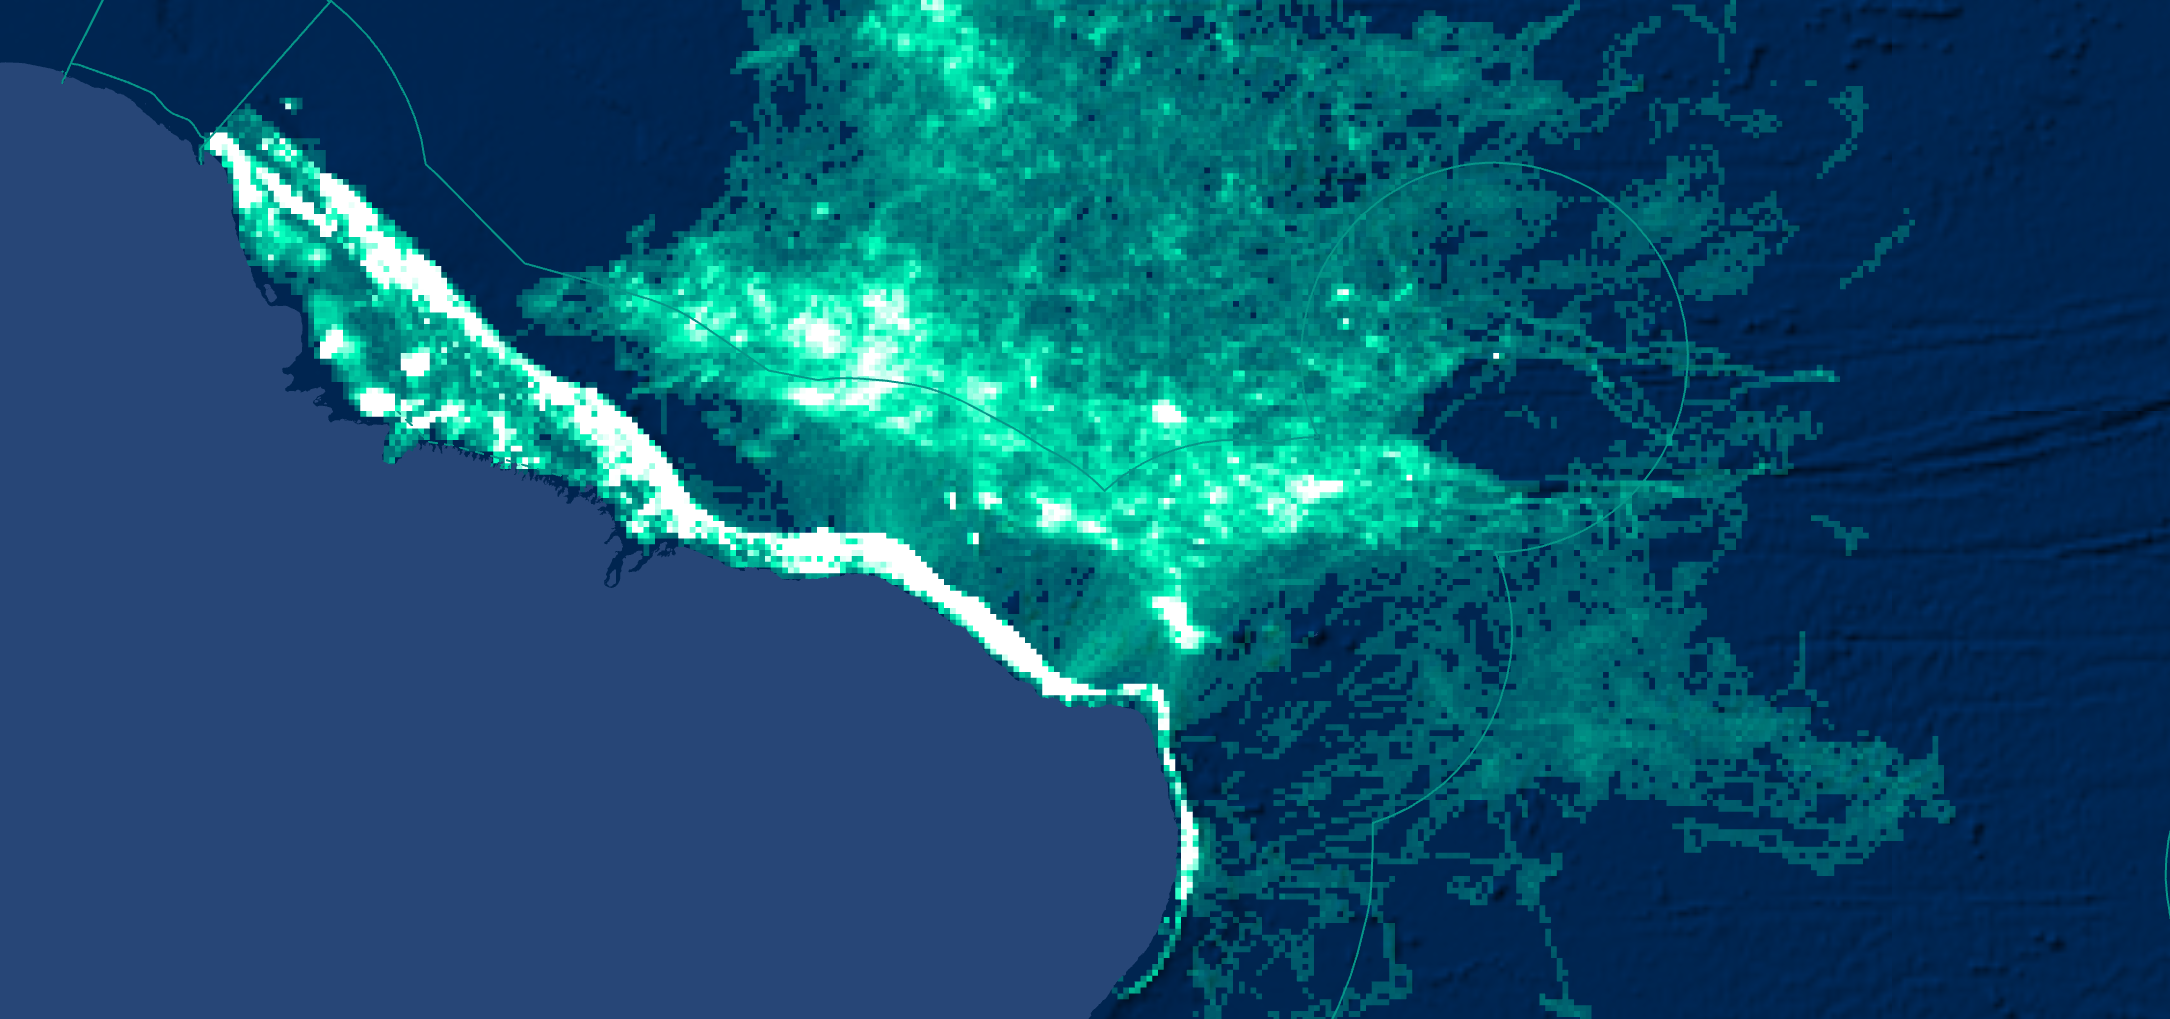
Users will notice a decrease in the apparent fishing activity in some regions, with the coast of Brazil serving as a prime example. While apparent fishing activity decreases in the updated view, this change reflects improved model precision rather than a real-world drop in fishing. The new model successfully filters out transiting vessels that were previously misclassified as fishing.
Compare the previous and updated models using the slider below.
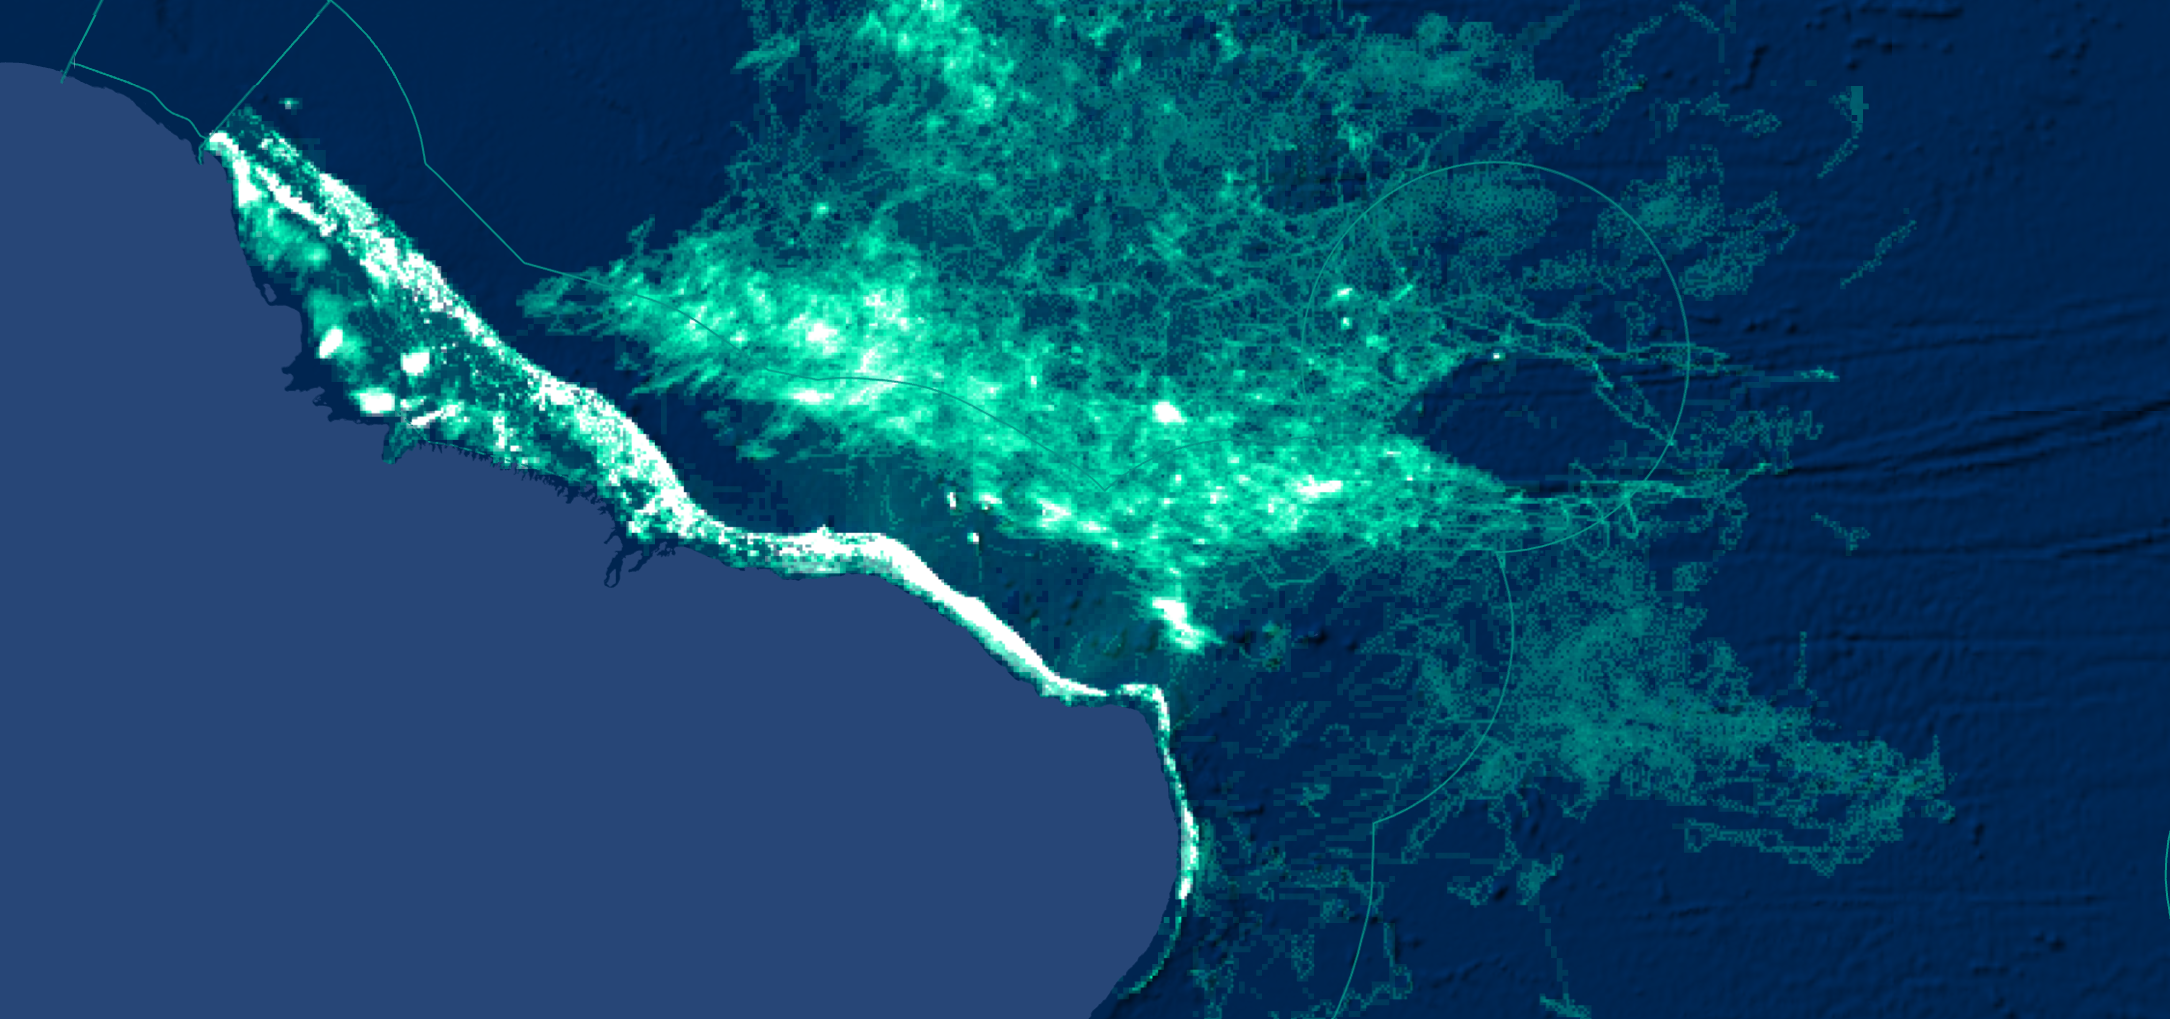

Smarter profiles ensure non-fishing vessels, such as cargo vessels, are more accurately represented on the map.
© 2026 Global Fishing Watch.
Why do some vessels now appear under a broader gear type?
When our model does not have sufficient confidence to identify a specific gear type, it assigns the vessel to a broader category. For example, a vessel previously classified as “pots and traps” may now be classified as “fixed gear” or “fishing.”
This approach reduces misclassifications, though some vessels previously labeled with a more specific gear type may now carry a broader tag. The change mostly affects the smaller fishing gear categories, such as other purse seines. These vessels have not disappeared from the data. To find them, include the broader categories in your search or analysis, such as “fishing.” If you use our APIs or packages, we recommend using combinedSourcesInfo.atomicClassSc, which is the model’s raw finest-level prediction before the threshold is applied.
Can users compare pre- and post-update data?
Yes. Starting Oct. 21, 2026, Global Fishing Watch is offering dual access to both pre- and post-release datasets for a limited time. Users and researchers can query both versions to analyze model differences. The previous version of the data can be accessed here. Feedback can be submitted directly via built-in reporting tools.
How to compare the new and previous data in the platform?
Global Fishing Watch has updated its apparent fishing activity and vessel classification data. To review changes or discrepancies between data versions, sign in to a Global Fishing Watch account.
The Global Fishing Watch map now defaults to the latest dataset (Pipeline version 5) but the previous version is available in a dedicated workspace, allowing side-by-side comparison of the same geographic area across versions.
To compare versions, open the current map in one browser tab and the previous one — labeled v4 – Outdated — in another. You can also find it in your workspace list, under Archived workspaces with the same label.
If your account includes a private country workspace, you can find its v4 copy in that same list. It contains the country data you already have access to.
The v4 – Outdated workspace is available for comparison only, and its layers will no longer be updated. Use the latest data for new analyses.
How to compare the new and previous data using public APIs?
Starting on Oct. 21, 2026:
- Requests using the alias latest will return the new data (Pipeline version 5).
- The v4 – Outdated data will remain available through its explicit :v4.0 identifier, but it will no longer receive updates.
- Datasets prior to v4 will be deprecated.
To compare the results, specify v4.0 in the dataset ID while the alias latest returns Pipeline version 5 data.
API datasets ID mapping
| Version 4 | Version 5 |
|---|---|
AIS
| AIS
|
Identity
| Identity
|
Imagery
| Imagery
|
When making a request using the latest alias, check the custom x-datasets HTTP header in the API response to determine which active dataset version is in use.
Are there any known limitations or caveats with this data release?
Global Fishing Watch recommends that its data be used alongside official vessel registries, local intelligence and original AIS or VMS information when reaching definitive legal or regulatory conclusions. Specific caveats include:
- Conservative vessel classification: To avoid false designations, the vessel model assigns specific subtypes — for example, “pole-and-line” — only when confidence is high. Otherwise, it defaults to broader categories like “generic fishing.”
- Detection challenges: Small-scale nearshore operations, short sets, and specific gear types — such as seines, fixed gear, set gillnets, set longlines and trollers — remain more challenging to detect automatically.
- Non-fishing overlap: Vessels with movement patterns that mimic fishing fleets — for example, eco-tour boats operating in the Galápagos — may occasionally still be misclassified.
- Apparent fishing activity by squid jiggers: Squid jigger activity is calculated using a separate dedicated model and is unaffected by the update to the general fishing model.
- Some false negatives in the apparent fishing activity: The general fishing model’s shift toward precision introduces false negatives in specific gear types. This change is especially evident for seines, fixed gear, pots and traps, set gillnets, set longlines and trollers.
Understanding changes to historical data
Does this data update mean my previous reports were wrong?
No. Your previous reports were based on the best available technology at the time.
As satellite capabilities and machine learning models improve over time, our algorithms also evolve. When we retrain our models using new data, user feedback, refined satellite imagery or improved processing techniques, we update historical estimates to reflect higher precision and accuracy.
Can I trust the data if it might change in the future?
Yes. Global Fishing Watch provides a science-backed, peer-reviewed picture of ocean activity based on the most advanced technology available. Updates to our data reflect our commitment to continual improvement, ensuring users always have access to the highest achievable precision to shine a light on activity across vast areas of the ocean where visibility was previously impossible.
Because no remote-sensing model provides 100 percent accuracy, we always recommend combining our data with complementary sources — such as local logbooks, AIS vessel tracking and regional fisheries management data — to cross-verify findings and build a robust, multi-layered picture of ocean activity.
Who should I contact for questions?
For general inquiries, contact [email protected]. For data-related questions, contact [email protected]. Our public platform and data request board are also available.