
Version 5 Data Pipeline Release
New release of our data pipeline including AIS, VMS, identity and imagery
- New release of our data pipeline including AIS, VMS, identity and imagery
- Data change: new general fishing model
- Data change: new vessel classification model
- Data change: anchorages, spatial measures and regions update
- How these new models and updates affect our datasets
- How these data changes affect our products
Overview
Global Fishing Watch has launched an improved version — version 5 — of our automatic identification system (AIS), vessel identity, imagery and vessel monitoring system (VMS) data pipelines. The data pipeline is a series of processes that we use to convert raw AIS, VMS, imagery and registry information to data products. The output of the pipeline includes estimates of apparent fishing activity and aggregated estimates of vessel identity over time that can be applied by users to determine vessel activity and history at sea.
We are simultaneously releasing two new AI models to improve our estimates of fishing activity and classification of both fishing and non-fishing vessels. We have reprocessed our full history record using the new models. Along with these models, we are updating our geographical boundary sources, anchorages dataset and spatial distance measures, which greatly impact our key activity and behavior datasets.
The breakdown below details which datasets are included in each specific pipeline and summarizes the impact on Pipeline version 5.
| Data Pipeline | Datasets affected in version 5 | Datasets not affected in version 5 |
|---|---|---|
| Automatic identification system (2012 - present) |
|
|
| Vessel identity (Start date depends on registry source) |
| |
| Imagery or object detection Vessel detections (2019 - present) Fixed infrastructure (2017 - present) |
|
|
| Vessel monitoring system - country specific data (Start date depends on country source) |
|
|
| Others |
|
Two new models, one global picture of fishing
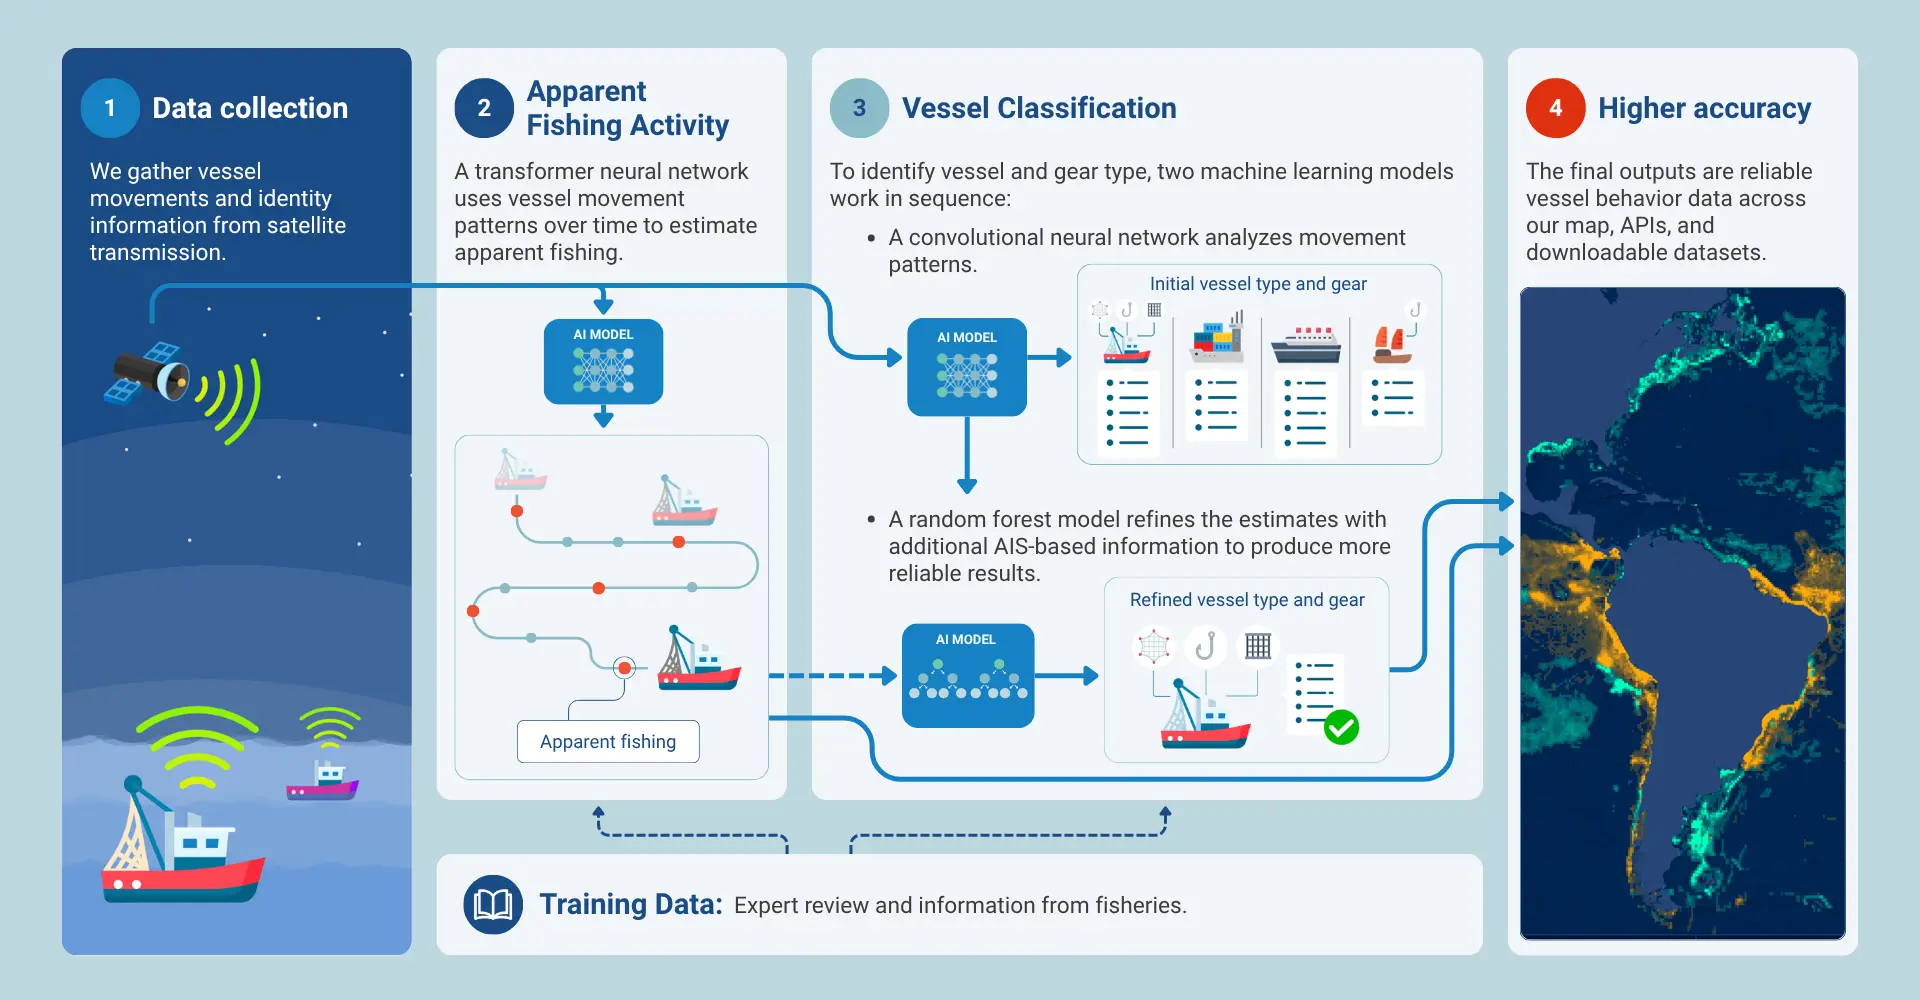
Learn how the two new models interact:
Global Fishing Watch uses artificial intelligence, geolocation data, fisheries logbooks and vessel registries to transform billions of satellite tracking points into a clear map of ocean activity. Here is how our machine learning models estimate apparent fishing activity and vessel classifications worldwide.
Mapping Ocean Activity:How Global Fishing Watch’s AI Models Process Data
Data change: New general fishing model
Overview
Our general fishing model studies how vessels move, using location signals they send through tracking systems, specifically AIS and VMS. It checks each point along a vessel’s track to estimate where and when the vessel was likely fishing. Read the full dataset documentation for more details.
Pipeline version 5 implements an entirely new general fishing detection model for both AIS and VMS. The change is extensive: a new AI model and substantially expanded training data, including the labeled vessel tracks used to teach the model what fishing looks like and measuring how well it performs.
Overall, the new model is more precise and more conservative. It removes large amounts of false positives in ports and transits. A false positive occurs when the model indicates fishing is happening, but it is not. This is a significant, intended change with broad downstream effects. It also introduces some false negatives, meaning fishing is likely occurring even if the model does not show it for specific gear types. In regions with poor AIS reception, the new model classifies many positions as fishing that previously had no fishing score. We improved this model thanks to feedback from our users and partners.
A note on terminology
Throughout these release notes, “fishing activity” means apparent fishing activity — estimated by the new general fishing model from vessel movement data. It is a model-based inference, not confirmed or verified fishing. Estimates should never be interpreted as a record of actual fishing. Global Fishing Watch data should always be used in combination with other sources, including ground-truthed data, before drawing conclusions or taking action. Additionally, we now use “apparent fishing activity” instead of “apparent fishing effort” across the products. For more information read the dataset update details.
© 2026 Global Fishing Watch.
AIS key results
Overall findings
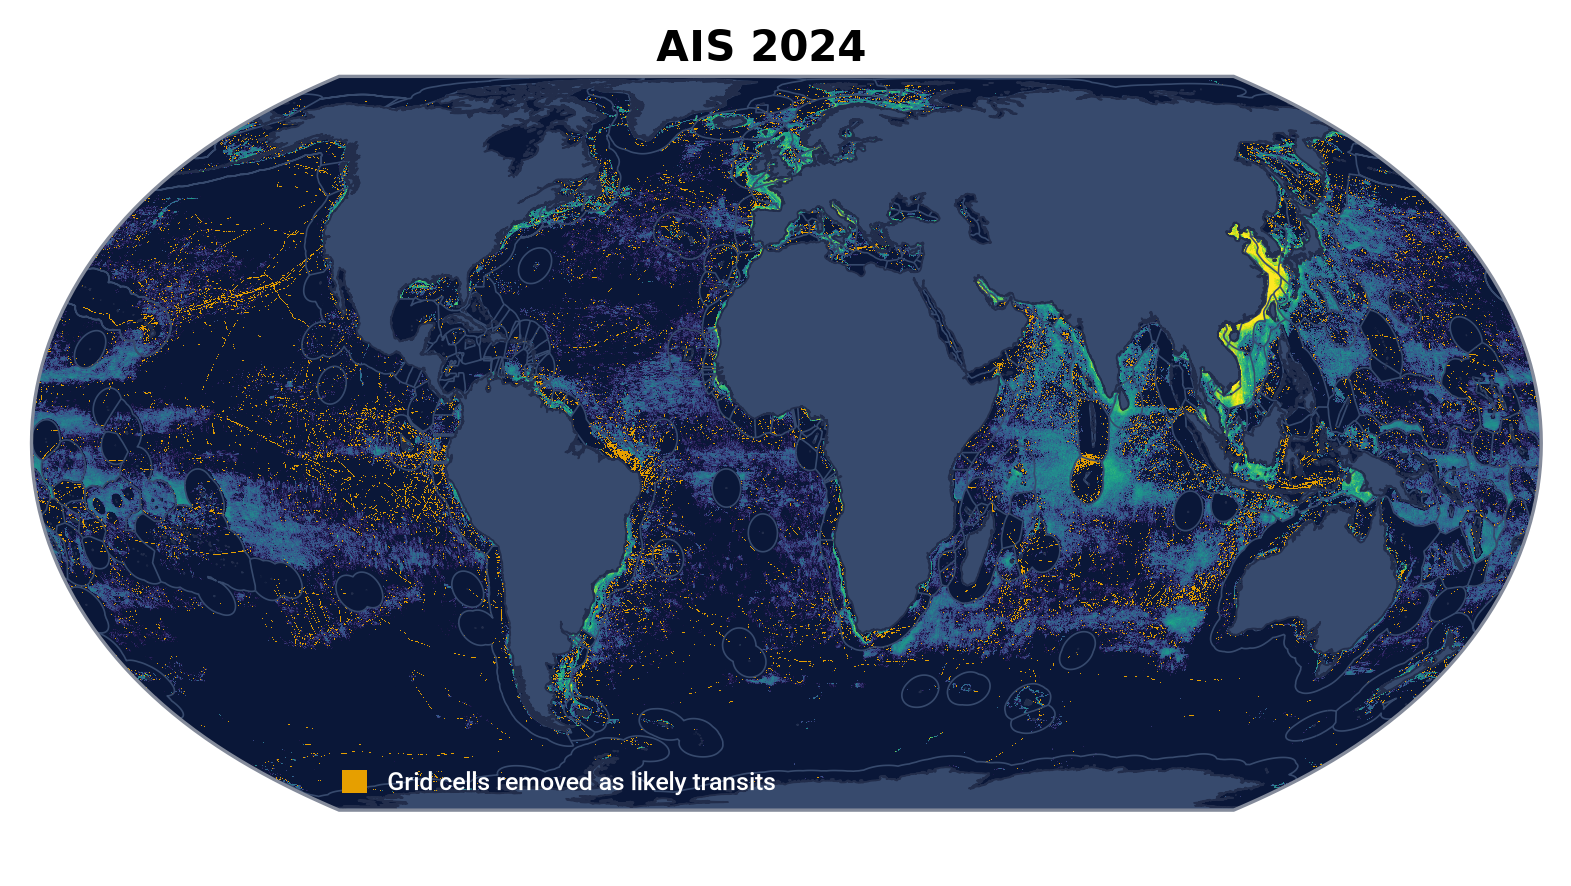
The overall AIS aggregate amount of fishing activity does not change much and changes are highly dependent on vessel type, time range, region and behavior.
- Aggregate fishing hours over time decreased by 3.55 percent for vessels classified as “fishing” in both Pipeline versions 4 and version 5 in the same year. Since 2015, there has been a clear trend of lower estimated fishing activity in Pipeline version 5 compared with version 4.
- The difference in fishing activity for the most recent timeframe ranges between minus 7.1 percent (2025) and minus 6.7 percent (2026 year to date).
VMS key results
Overall findings
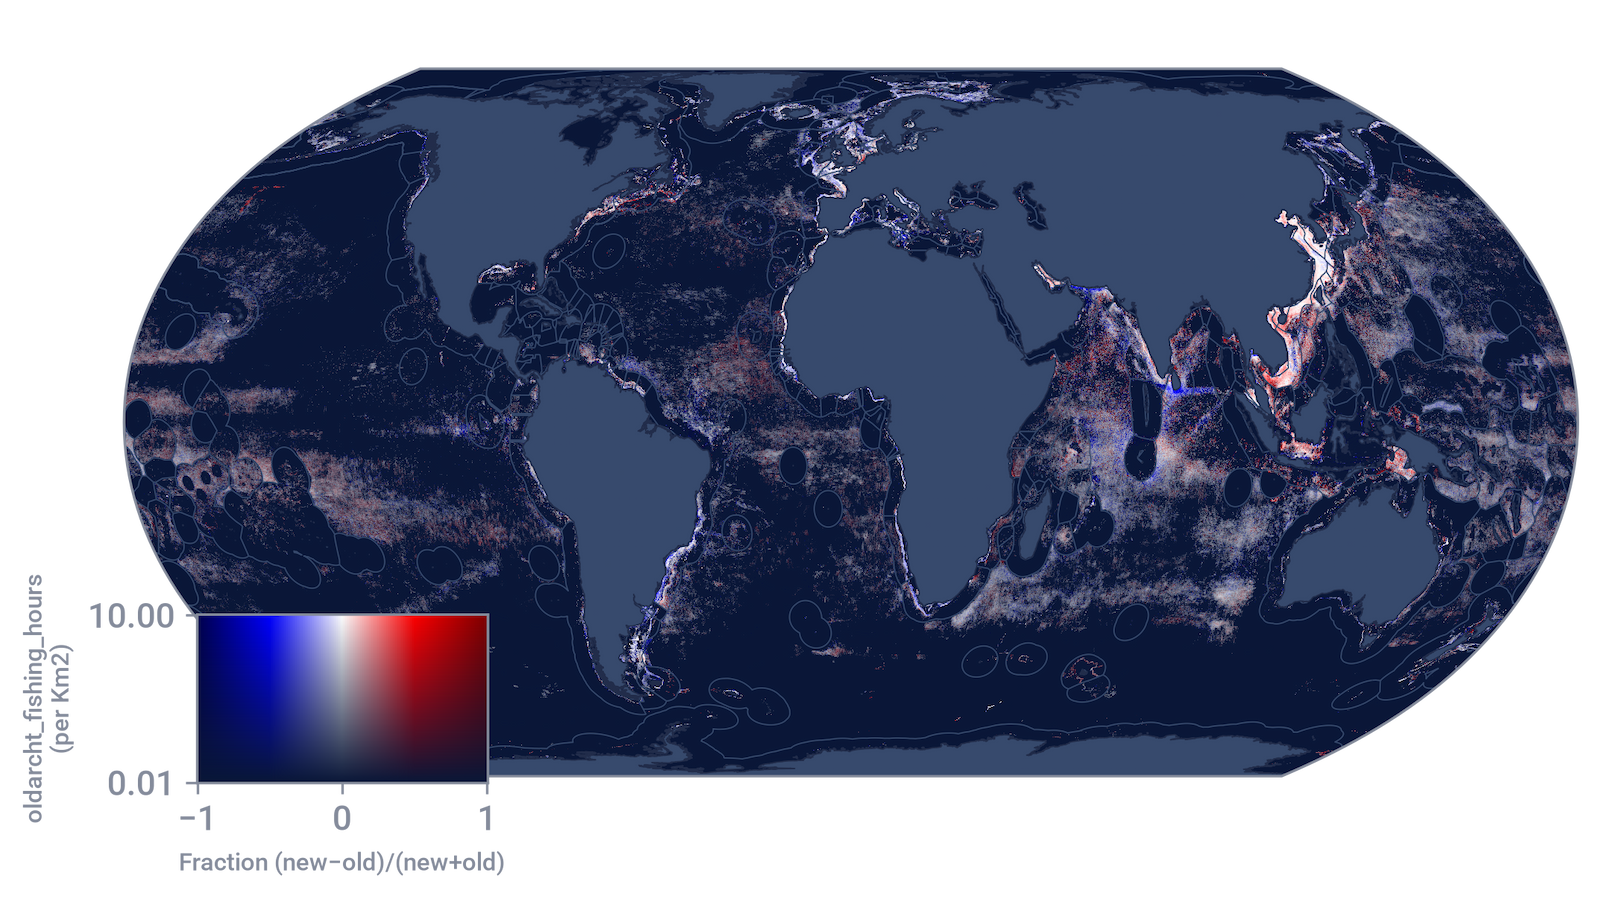
The main changes identified in VMS are independent of source ping rate, gear type or data feed. When investigating vessels that transmit both AIS and VMS, comparing their tracks on the two data feeds shows the same changes in both — transits lose their fishing labels and in some cases evident fishing is trimmed.
- Fishing hours decreased significantly across all years. Total fishing hours fell from 92.4 million to 67.1 million — a 27.3 percent drop across the full historical record (2012 through December 2025).
- The main driver is the new fishing-detection model. The reduction in fishing hours comes mostly from removing false positives, such as transits and periods when vessels were stopped or drifting, which the previous model misclassified as fishing.
For more details about our new general fishing model read the dataset update details.
Data change: New vessel classification model
Overview
To understand what a vessel is doing, we first need to know what kind of vessel it is, such as a cargo ship, a trawler or a longliner. Our vessel classification model estimates vessel type and gear type using broadcast tracking data — AIS and VMS — alongside other sources. For more details, see the vessel classification model documentation.
Global Fishing Watch has updated its vessel classification model for the first time since the organization was founded. To address performance degradation of the original model and user feedback, we created a secondary classifier — a random forest machine learning model. While our neural network relies on AIS position data only, the secondary classifier uses static AIS identity information, self-reported vessel type, and broad activity features to build a more complete picture of each vessel, identified by its maritime mobile service identity (MMSI).
We are also introducing four new models to estimate length, tonnage, engine power and maximum speed.
Data Sources for New Vessel Classification Model
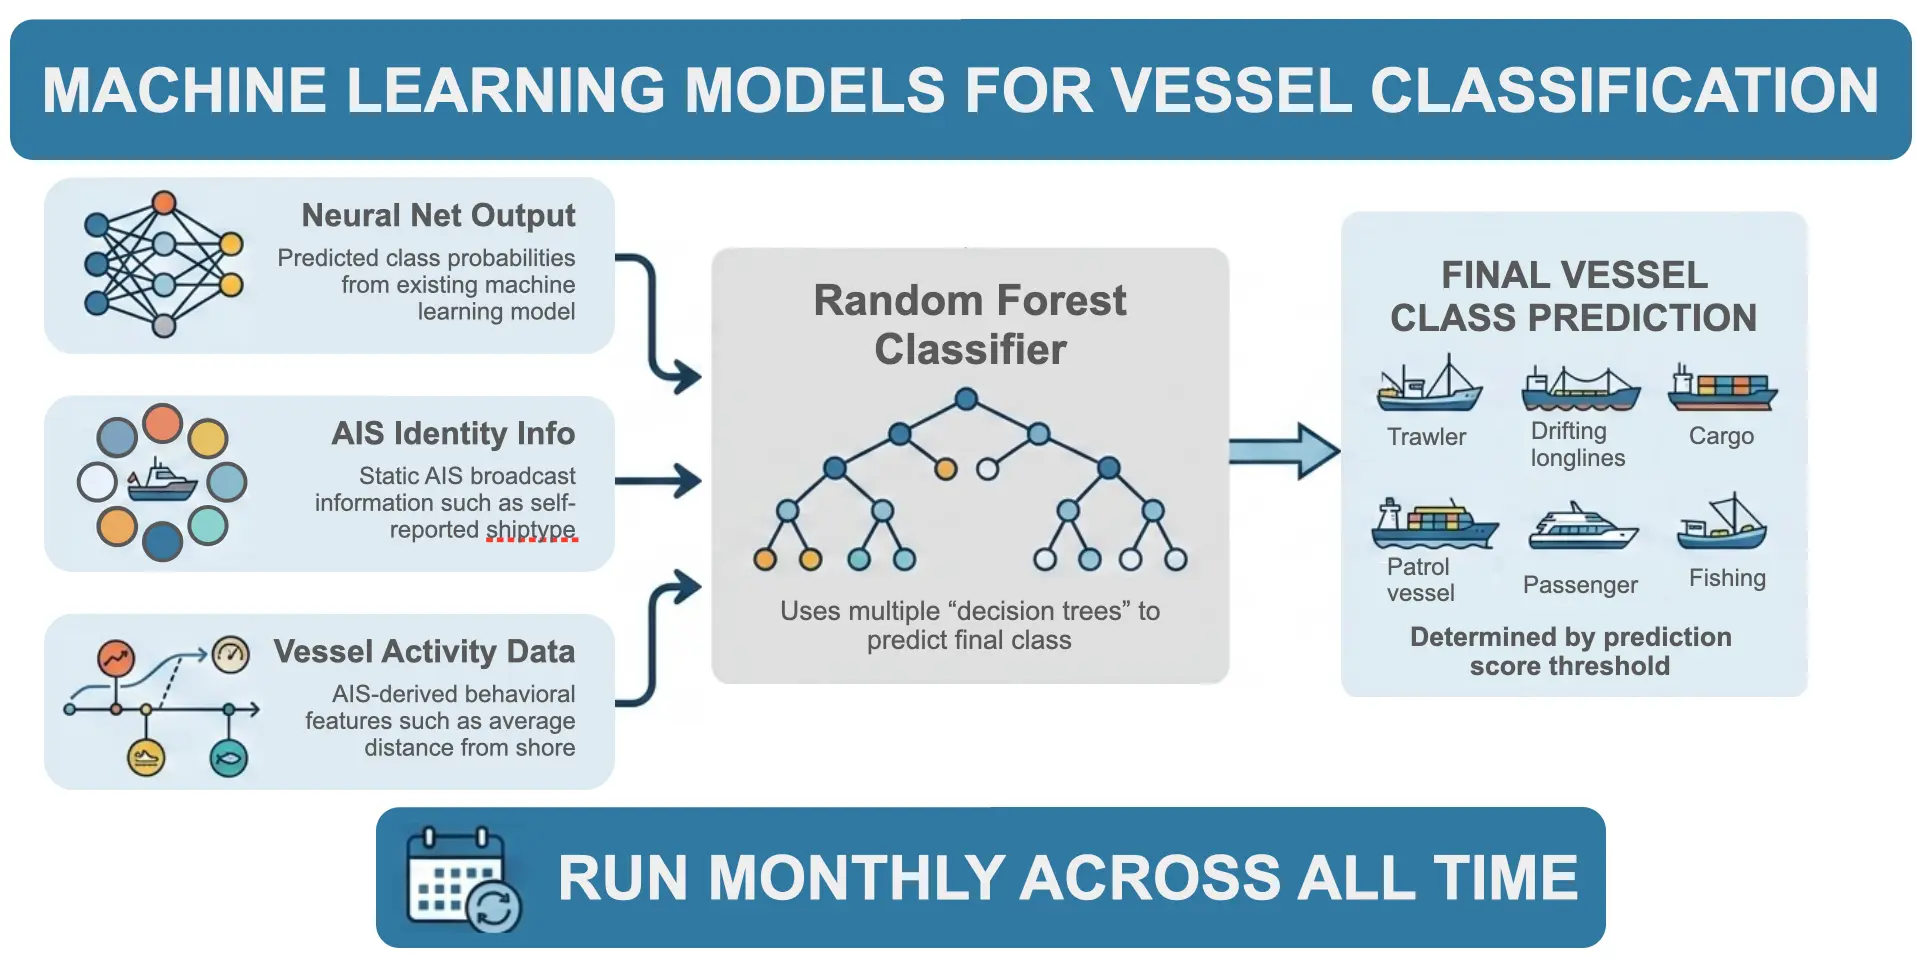
The secondary classifier model combines outputs from the neural network with information from AIS. The two models draw on different information: the neural network analyzes vessel tracks directly, learning from movement patterns, while the secondary classifier relies on static AIS attributes. Both models are trained using cleaned vessel classes from registry data as ground-truthed labels.
Previous vessel type and gear type estimations from our neural network model were overwritten with registry values wherever available. To avoid incorrect or outdated registry information, we removed registry values from the current secondary classifier model outputs. For more details read “Trade-offs” in gear type specificity under confidence thresholds.
Key results
- Fishing vs. non-fishing: About 3 percent of vessels changed classification, shifting between fishing and non-fishing designations. Most new fishing classifications align with self-reported vessel data. In 96 percent of cases, the vessel either identifies as a fishing vessel via AIS or leaves its vessel type unstated, ensuring broadcast data does not contradict the new classification.
- Vessel type “Other”: Most changes — about 65 percent — involved vessels previously classified simply as “Other” that now have specific designations: fishing gear type or non-fishing. Consequently, the new model reduces vague outputs in favor of actionable data.
- Gear identification: Classification of buoys and other fishing gear improved by 99.2 percent. Given the sheer volume of gear in the dataset, this represents one of the most significant improvements in total vessel counts.
- Regional performance: The secondary classifier model shows the clearest gains in regions with poor AIS reception, such as the South China Sea, where incomplete tracks previously hindered neural network performance. The random forest model incorporates additional AIS-derived features beyond vessel tracks, producing more reliable classifications in low-reception zones.
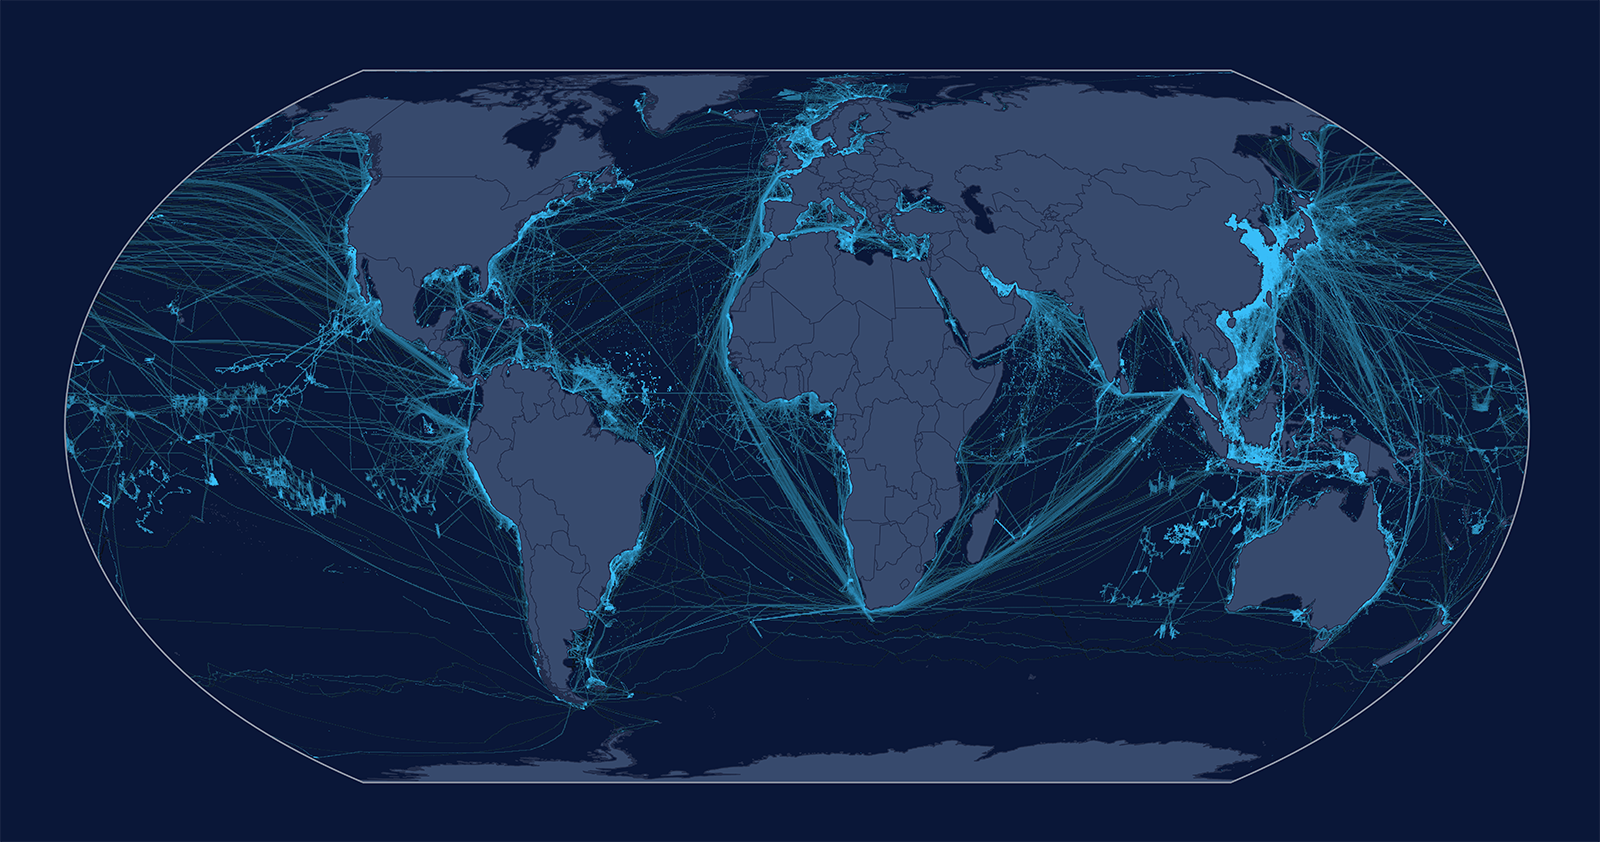
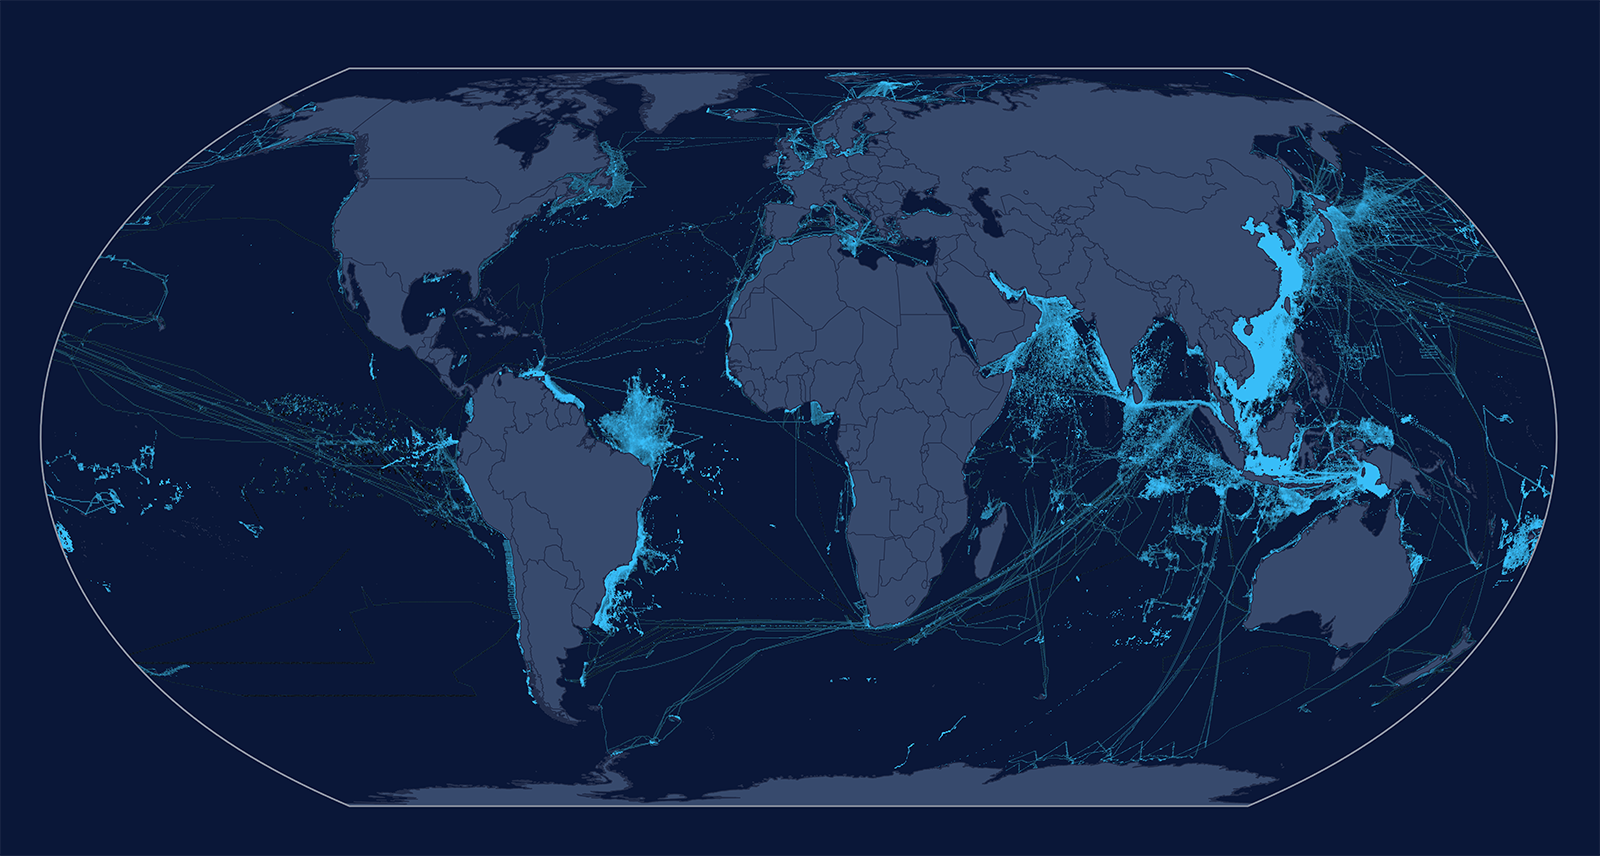
- Global distribution: Worldwide, the model reduces the number of clearly transiting vessels misclassified as fishing. As illustrated below, the top figure shows the global presence (2024-2026) of vessels formerly classified as fishing that the random forest reclassified to non-fishing classes. The bottom figure shows the inverse: vessels formerly not classified as fishing that the random forest reclassified to fishing.
Global Vessel Presence, Pipeline 4
© 2026 Global Fishing Watch.
Global Vessel Presence, Pipeline 5
© 2026 Global Fishing Watch.
How confidence thresholds impact gear classification specificity
We use confidence thresholds during vessel classification. When the top-scoring class for a vessel falls below the general 0.35 confidence threshold, the classification defaults to the next broader parent class — for example, defaulting to a general “fishing” vessel rather than a “set gillnet” vessel. This prevents many incorrect fine-grained classifications, but it also removes specificity from some correct predictions. Our classification system does not overwrite model estimates with registry values to avoid using incorrect or outdated information. A review showed that conflicts between model and registry values are rare and stem from errors in both sources. In 2027, we plan to improve how we incorporate registry information and user feedback to further reduce classification inaccuracies.
Access model predictions via API
For vessels with low gear-type specificity, users can still gain insight into possible classifications. API and package users can access the combinedSourcesInfo.atomicClassSc field, which provides the model’s raw, finest-level prediction before confidence thresholds are applied.
Note on impact of vessel type and gear type changes
The changes in vessel type and gear type may directly impact data interpretation or analytical output. We are currently evaluating a feedback system to better integrate manual vessel-identity updates into our classification decisions. When strong external evidence shows that our estimated vessel or gear type is incorrect, we override the model’s prediction with a validated manual correction for the relevant period. For the Pipeline version 5 release, we reviewed and corrected the classification of 350 vessels. We are currently developing a more comprehensive, standardized override protocol to share in 2027.
Update of vessel classification decision tree diagram
We have updated the diagram showing how we classify vessel and gear types. Because our models require at least 500 position points annually to generate a prediction, vessels below this threshold are listed as “insufficient data.”
Detailed updates on key vessel type and gear type changes
Below are details on the vessel and gear type updates between Pipeline versions 4 and 5. Please keep the following key points in mind when reviewing these tables:
- Activity vs. type changes: The percent change in vessel and gear type counts exceeds the percent change in vessel activity, including apparent fishing activity. This discrepancy is likely driven by identity updates, which are more common among low-activity vessels.
- MMSI-level counting: Vessel counts are measured at the MMSI level. A single physical hull may be counted more than once because multiple physical hulls can share or transmit under a single MMSI over time.
Learn about our new vessel classification model, biases, data caveats and more.
Data change: Port and anchorages, spatial measures and regions update
Ports and anchorages
We added 5,366 new anchorages to our dataset and the anchorages source table has been aligned between AIS and VMS to use this single source of updated information. Updated port and anchorages feed directly into our models and data outputs, including distance from port and port visit detection. The corrected data improves accuracy for port visit events and distance-based filters.
Brazil accounts for the largest single-country addition with 4,068 new locations. We added new AIS and VMS anchorages across 13 countries. VMS-driven additions account for the majority of new anchorages. We removed incorrect anchorages from the dataset that may have previously caused false port visits.
Spatial measures
- We combined three spatial datasets — distance from port, distance from shore, and bathymetry — into a single, consistent map grid. All Pipeline version 5 data now uses this grid as its standard reference for location. We also made a small adjustment to the dataset that measures distance from the nearest coastline.
- We updated our source of bathymetry data to the ETOPO 2022 global relief model.
Regions update
For 2026, we have updated the source data for three regional shapefile layers:
- Food and Agriculture Organization of the United Nations (FAO) Statistical Areas: Refreshed to the latest FAO revision (Feb. 1, 2026). The
faoandmajor_faolayers incorporate our manual coastline. - General Fisheries Commission for the Mediterranean (GFCM) Fisheries Restricted Areas: Version updated July 22, 2026.
- ProtectedSeas: Version updated Aug. 27, 2026.
Other layers — such as the exclusive economic zone (EEZ), high seas, territorial seas, and Indian Ocean Tuna Commission (IOTC)—are unchanged for this cycle. See full list of regions and sources.
How these new models and updates affect our datasets
Vessel identity: Examples of changes you may notice
Each data pipeline release undergoes extensive quality assurance (QA) and review. This includes impact analyses of data prototypes, validation by dedicated QA analysts and internal staff testing. As part of this process, Global Fishing Watch analysts compared Pipeline version 5 with version 4 across dozens of regions, fleets and datasets. Follow these instructions to view previous versions.
⚠️ IMPORTANT CAVEAT: The examples below illustrate the types of changes you may notice when transitioning to Pipeline version 5. They do not represent a complete list or a comprehensive measurement of changes across any specific region or fleet. Each figure is drawn from a single regional review of pre-release data and should be treated as an example rather than a global statistic. Results for your specific area of interest may vary.
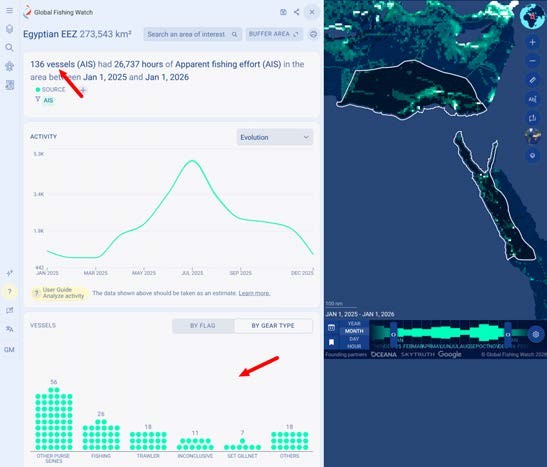
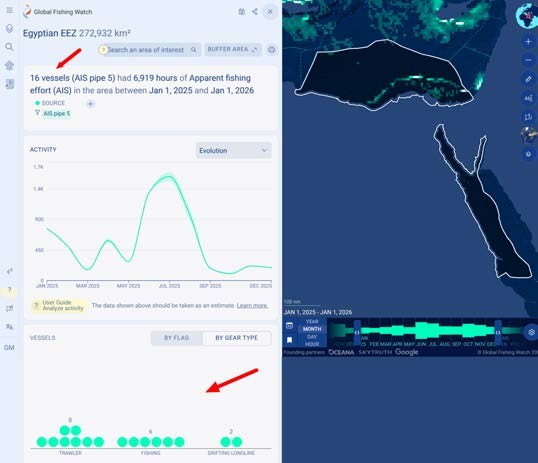
- Better vessel types: Pipeline version 5 more accurately determines which vessels are fishing vs non-fishing. For example, vessels that were considered fishing in version 4 may now be labeled as passenger or cargo. In Egypt’s EEZ, for example, the number of Egyptian vessels showing fishing activity fell from about 136 to about 16.
| Pipeline version 4 | Pipeline version 5 |
|---|---|
 |  |
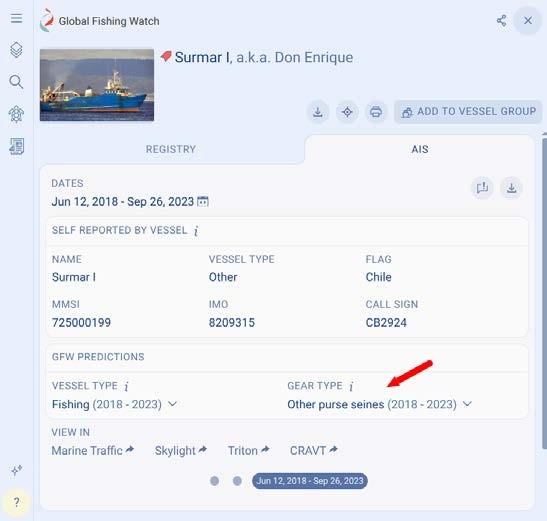
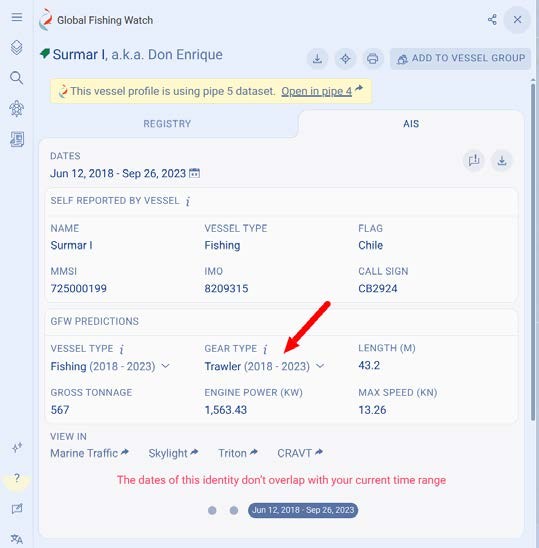
- Gear types updates: Several tuna purse seiners and trawlers listed in regional fisheries management organization (RFMO) or national registries now have corrected gear types, replacing “inconclusive” or inaccurate classifications from version 4.
| Pipeline version 4 | Pipeline version 5 |
|---|---|
 |  |
What this means for users
- Known limitation: Generic “fishing” labels. When model confidence for a specific gear type is low, the vessel defaults to the broader “fishing” label. This impacts gear-specific filtering; for instance, filtering a map exclusively by “squid jigger” excludes vessels assigned the general “fishing” label, even if those vessels are squid jiggers. Model updates are planned to refine gear-type attribution.
- Incorrect vessel type reporting options:
- Feedback board: Submit a note on the public Global Fishing Watch Feedback Board.
- Platform feedback form: Use the feedback link in the left sidebar of the Global Fishing Watch Map.
Apparent fishing activity
AIS
The main changes on apparent fishing activity identified in AIS are related to changes in vessel and gear types from the new secondary classifier as well as from the new fishing detection model.
New secondary classifier reshapes AIS fishing activity:
- Changes in apparent fishing activity are driven largely by changes from the new vessel classification model more than from the new general fishing detection model. Vessels no longer considered “fishing” account for a minus 8.41 percent decrease in apparent fishing activity, while those newly classified as “fishing” account for an 8.26 percent increase. Although these changes largely offset one another at a global scale, shifts in apparent fishing activity for individual vessels are often driven by reclassifications in vessel type.
- In particular, many vessels moved from specific gear types to the general “fishing” class (for example, from “set gillnets” to “fishing”), and some vessels previously classified as “non-fishing” are now classified as “fishing” — among other reclassifications. As a result, total apparent fishing activity for the “fishing” class increased by 42 percent, while activity attributed to more specific gear types decreased:
| AIS gear type | Change in total apparent fishing activity |
|---|---|
| Other purse seines | -99.4% |
| Set gillnets | -89% |
| Pole and line | -86% |
| Dredge | -85% |
| Set longlines | -79% |
| Fixed gear | -53% |
| Tuna purse seines | -7.8% |
| Drifting longlines | +1.93% |
| Trawlers | +3.11% |
| Squid jiggers | +24% |
| Driftnets | +32.4M hours (this is a new gear type so Pipeline version 4 has no recorded hours) |
Note: The percentage change in vessel and gear type counts is greater than the percentage change in apparent fishing activity. This is likely because identity reclassifications occur more frequently among vessels with low activity levels.
Effect of the new fishing detection model alone:
- Vessels classified as “fishing” in the previous as well as the new version see a minus 3.55 percent decrease in apparent fishing activity. We attribute this change to the new fishing detection model.
- To isolate changes caused by the new fishing detection model, we compared apparent fishing activity for the same vessels that kept the same gear type in Pipeline version 4 and version 5. The results are below:
| AIS gear type | Change in total apparent fishing activity |
|---|---|
| Purse seines | -37% |
| Pots and traps | -29% |
| Fixed gear | -24% |
| Set gillnets | -23% |
| Dredge | -13% |
| Set longlines | -12% |
| Trawlers | -4.6% |
| Fishing | +1.4% |
| Drifting longlines | +2.5% |
| Tuna purse seines | +21% |
Combined effect by year:
- A comparison between Pipeline version 4 and version 5 shows an increase in fishing activity, particularly in 2012 and until 2015. All subsequent years show a decrease in apparent fishing activity, with the exception of 2022.
- Tuna purse seines show the highest growth in earlier years, jumping +359 percent in 2012 compared to a more modest +22 percent increase in 2016.
VMS
Country/fleet-level findings
Total apparent fishing activity changes considerably across VMS sources; in some of them, the new model reduced fishing hours by up to 47 percent. In addition, there were large reductions of in-port fishing hours across sources.
The five largest sources (Brazil, Peru, Norway, Ecuador and Panama, which produce 95 percent of the total drop) land mostly between minus 26 percent and minus 30 percent, despite having different gears, vessel types and ping rates. The table below shows the main sources, ordered by size. The “change” column covers the full time range through 2025. An asterisk (*) marks sources that are too small or too new for their change to reflect model effects. Note that the fishing hours in the table below are calculated over different periods, depending on the data available per country.
| Source | Fishing hours (M) | Change | Why |
|---|---|---|---|
| Brazil | 40.3 → 28.6 | −29% | The most representative case: a large, dense fleet with mixed gear showed a consistent decrease of 27 to 30 percent each year since 2016. Handline gear may see increased false negatives, while set gillnets show substantially improved predictions. |
| Peru | 25.0 → 18.3 | −26% | A decrease of 23 to 32 percent annually since 2020. Its earlier years fluctuated more because the fleet data was still being incorporated and coverage was changing year to year. Additionally, Pipeline version 4 excluded all apparent fishing activity within 5 nautical miles (9,260 meters) of the coast from the published data because the old model overpredicted fishing there; with the improved model, that exclusion has been removed. Approximately 637,000 hours of near-shore fishing from 2012 to 2025 (3 percent of Peru's fishing hours, mostly purse seining in the 3 to 5 nautical mile band) are published for the first time, including some activity in the 0 to 3 nautical mile artisanal-only zone. Within 5 nautical miles, the new model identifies 64 percent less fishing than the old one, though false positives may still remain. |
| Norway | 11.1 → 7.8 | −30% | The most stable source over the long run: every one of its 14 years shows a decrease of 26 to 32 percent. |
| Ecuador | 7.1 → 5.2 | −27% | Ecuador's feed contains roughly 20,000 registered vessels, but only about 700 account for nearly all of its published fishing hours; these active vessels drive the reduction of 27 percent, consistent with the model change. The rest transmit almost nothing (about two positions per month), too little for the model to detect their activity. |
| Panama | 3.3 → 2.8 | −14% | Public data primarily covers Panama's international fleet (its domestic fleets are published only from May 2026). Within that fleet, longliners, which hold most of its fishing hours, show an ordinary decrease of about 25 percent, while purse seiners increase: the old model detected very little of their fishing and the new one detects about twice as much. The two effects largely offset, leaving a mild net change. |
| Chile Small Fisheries | 3.0 → 2.1 | −27% | In line with the general reduction pattern: every year with data (2019 onward) shows a decrease of 19 to 34 percent. |
| Costa Rica Avanzados | 1.6 → 0.9 | −47% | This fleet has a two-hour polling rate, which made it difficult for the old model to distinguish fishing from other slow movements. Version 4 classified 47 percent of the fleet’s transmitted hours as fishing. This high percentage remained nearly unchanged each year, despite considerable variation in the fleet’s activity. The new model produces more realistic year-to-year variation, with fishing activity decreasing from 32 percent of transmitted hours in 2021 to 22 percent in 2025, averaging approximately 27 percent across the time range. |
| Chile Industry | 0.8 → 0.6 | −23% | Stable change: Between minus 21 percent and minus 25 percent in every year with available data. |
| Papua New Guinea | 0.19 → 0.21 | +13% * | About 40 vessels, with usable data available only from 2023 onward. Before then, they transmitted only a few positions per month — too few for either model to reliably identify their activity. |
| Costa Rica UFIND | 0 → 0.46 | New feed * | Published for the first time: it includes positions starting 2022. |
Examples of changes you may notice
Each data pipeline release includes an extensive quality assurance and review period, including an impact analysis of any data prototype, dedicated review by our QA analysts, and an internal staff review in a testing environment. As part of this process, Global Fishing Watch analysts compared Pipeline version 5 with version 4 (to view the previous version, follow these instructions) across dozens of regions, fleets and datasets.
⚠️ IMPORTANT CAVEAT: The cases below are examples only. See more details here.
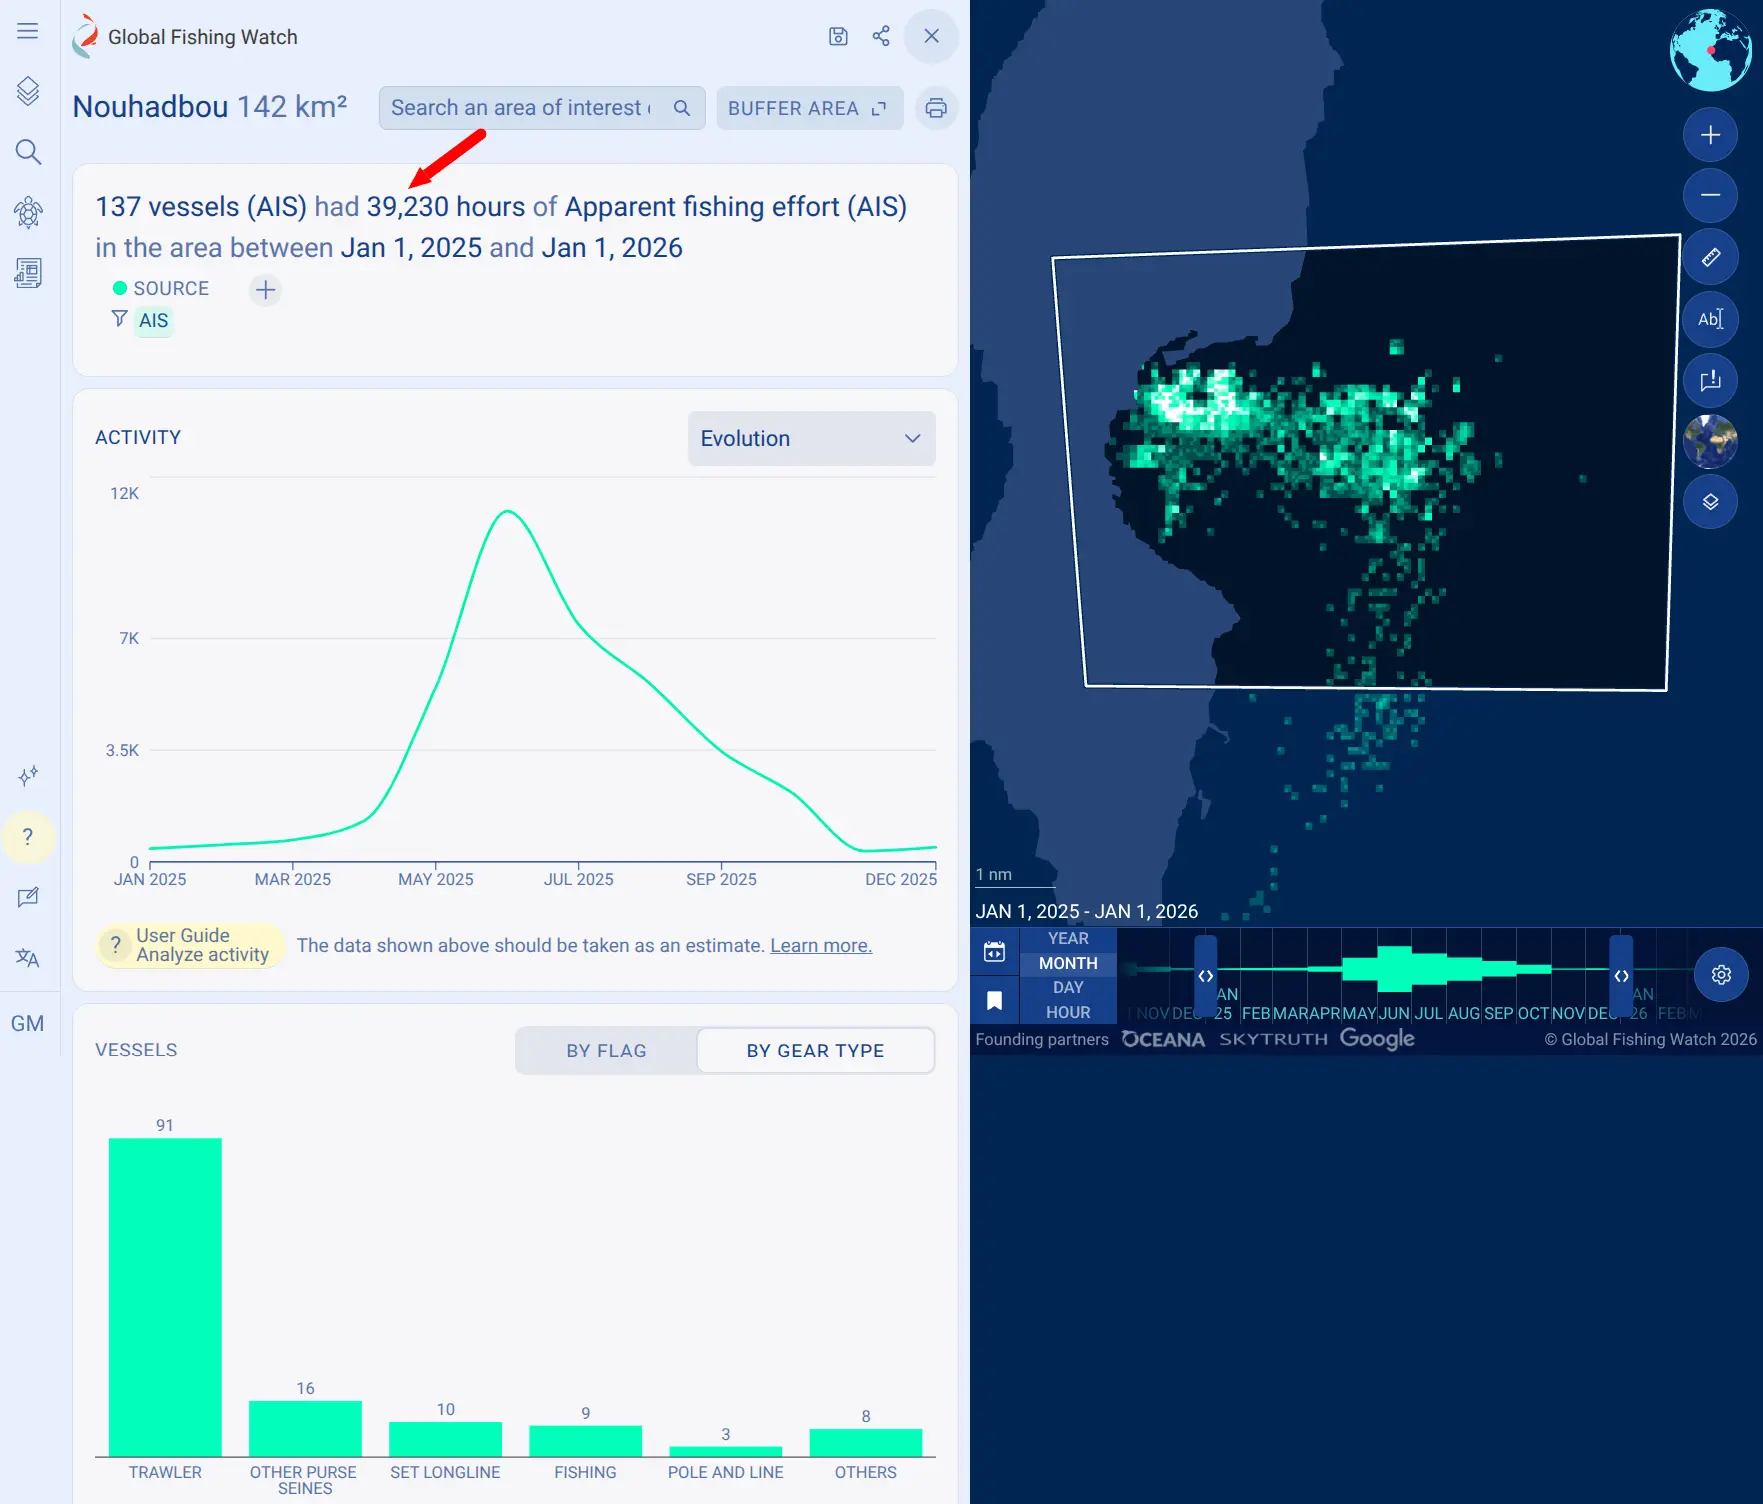
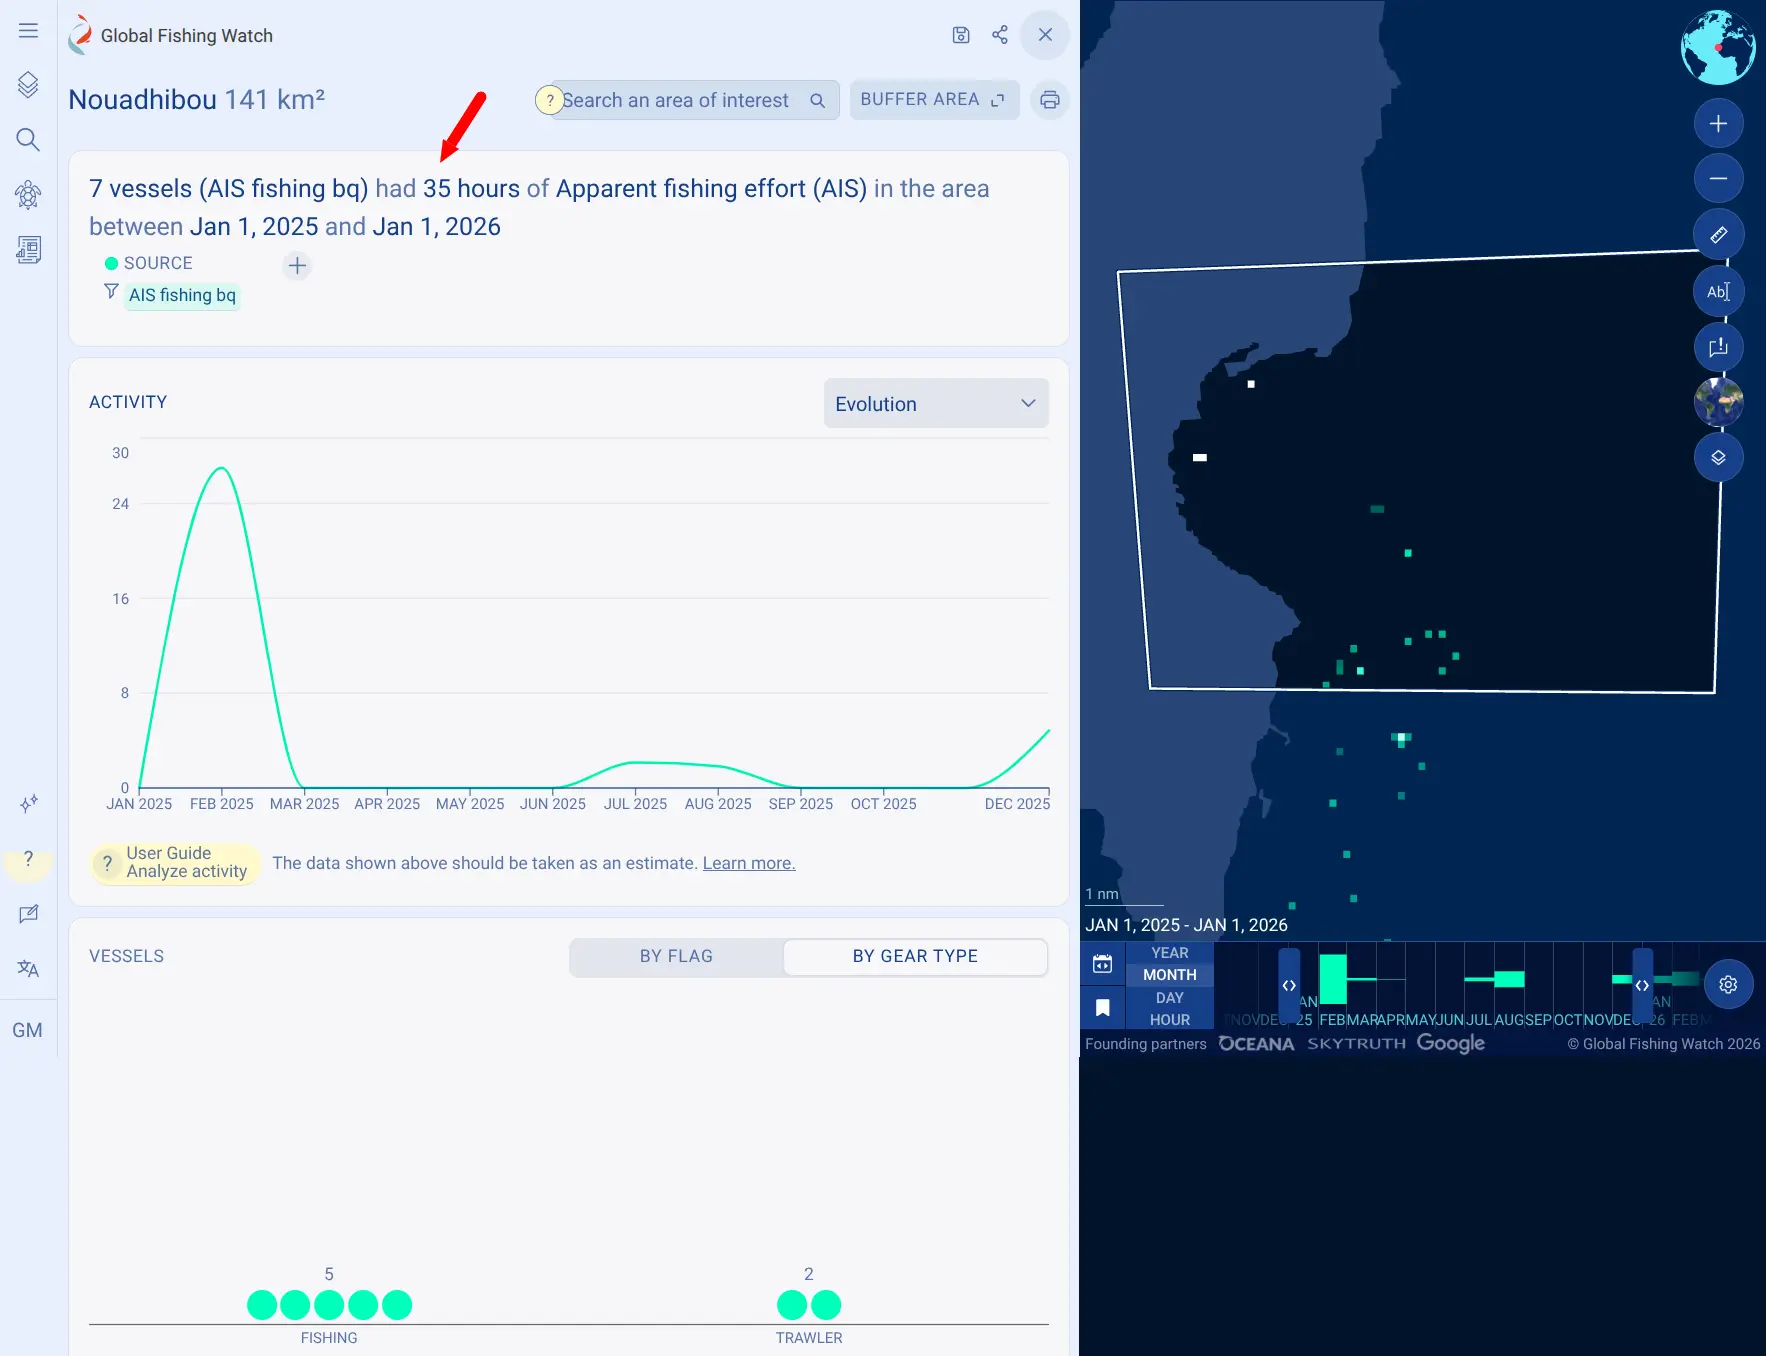
Near ports: Pipeline version 4 often counted vessels as fishing when they were slowing down or maneuvering near ports. Pipeline version 5 largely fixes this. Be aware that Pipeline version 4 data applies a distance-from-port filter by default. We removed this filter for both comparisons, so results may differ from what you saw in version 4.
Around Nouadhibou, Mauritania, fishing hours near the port fell from about 39,000 to about 35.
| Pipeline version 4 | Pipeline version 5 |
|---|---|
 |  |
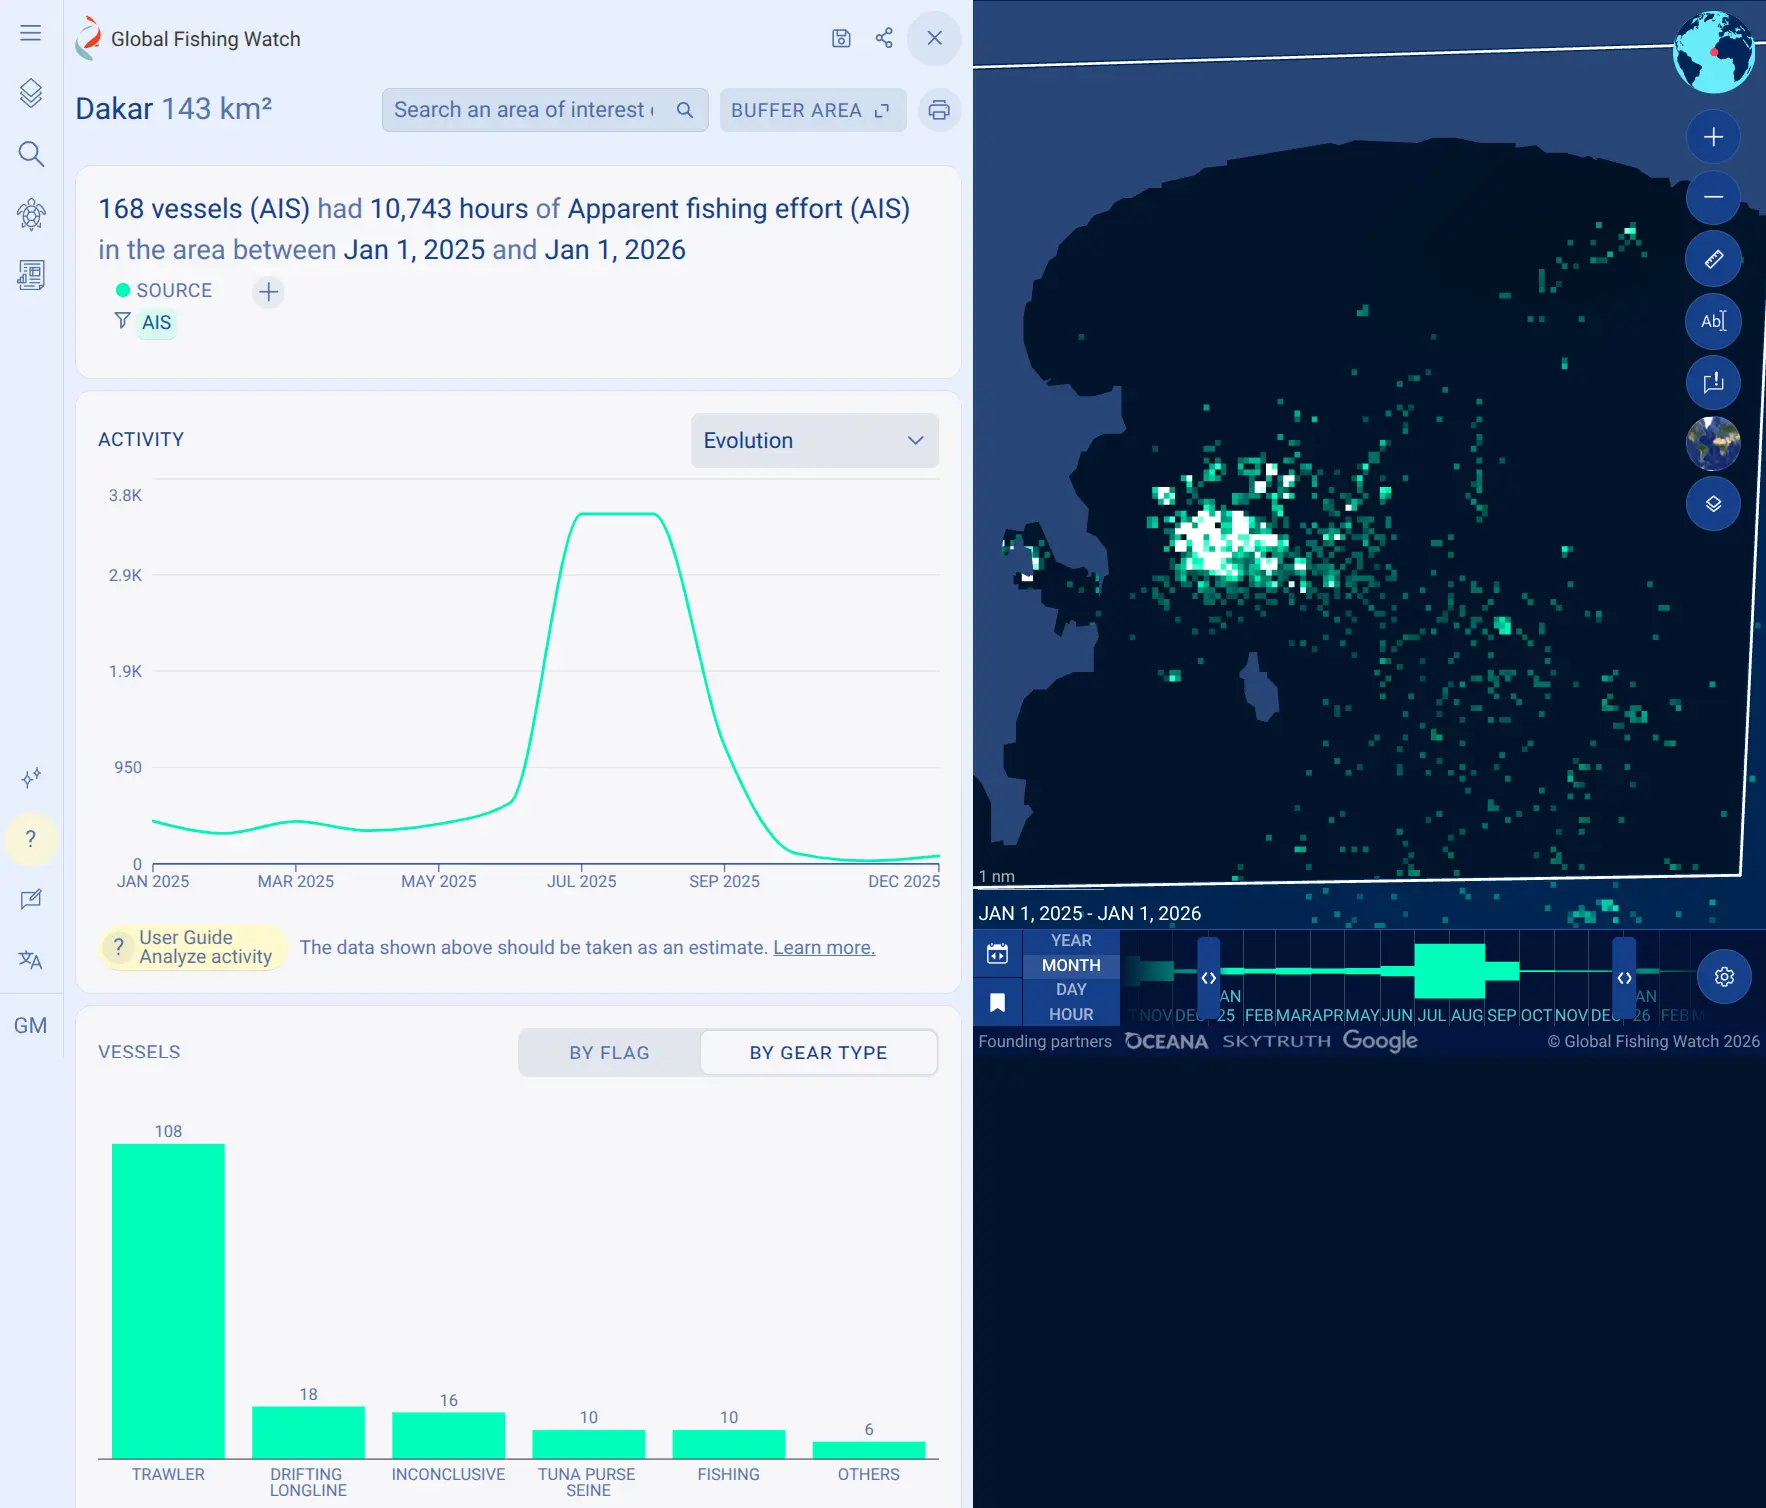
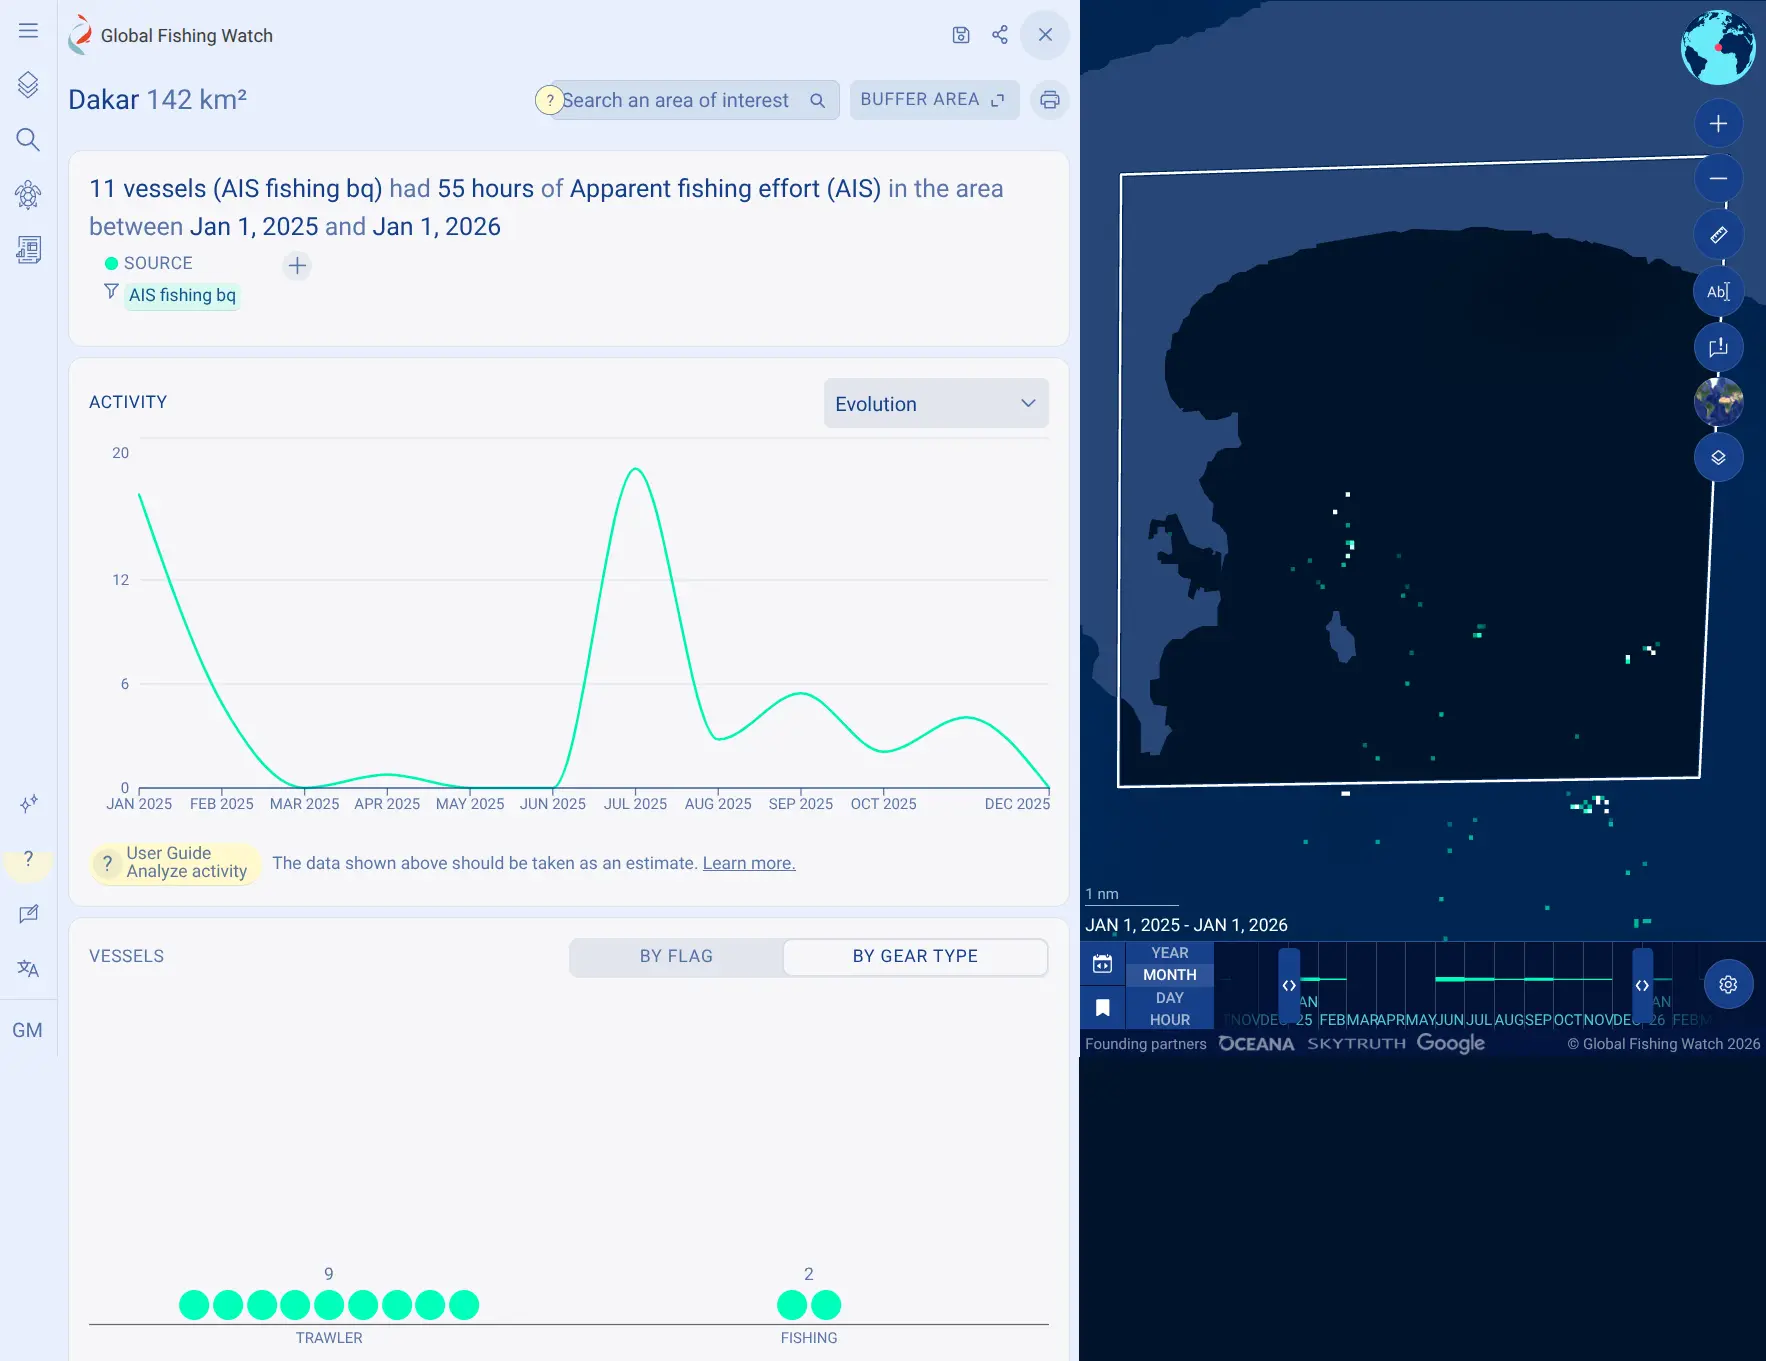
At Dakar, Senegal, fishing hours fell from more than 10,000 to about 55.
| Pipeline version 4 | Pipeline version 5 |
|---|---|
 |  |
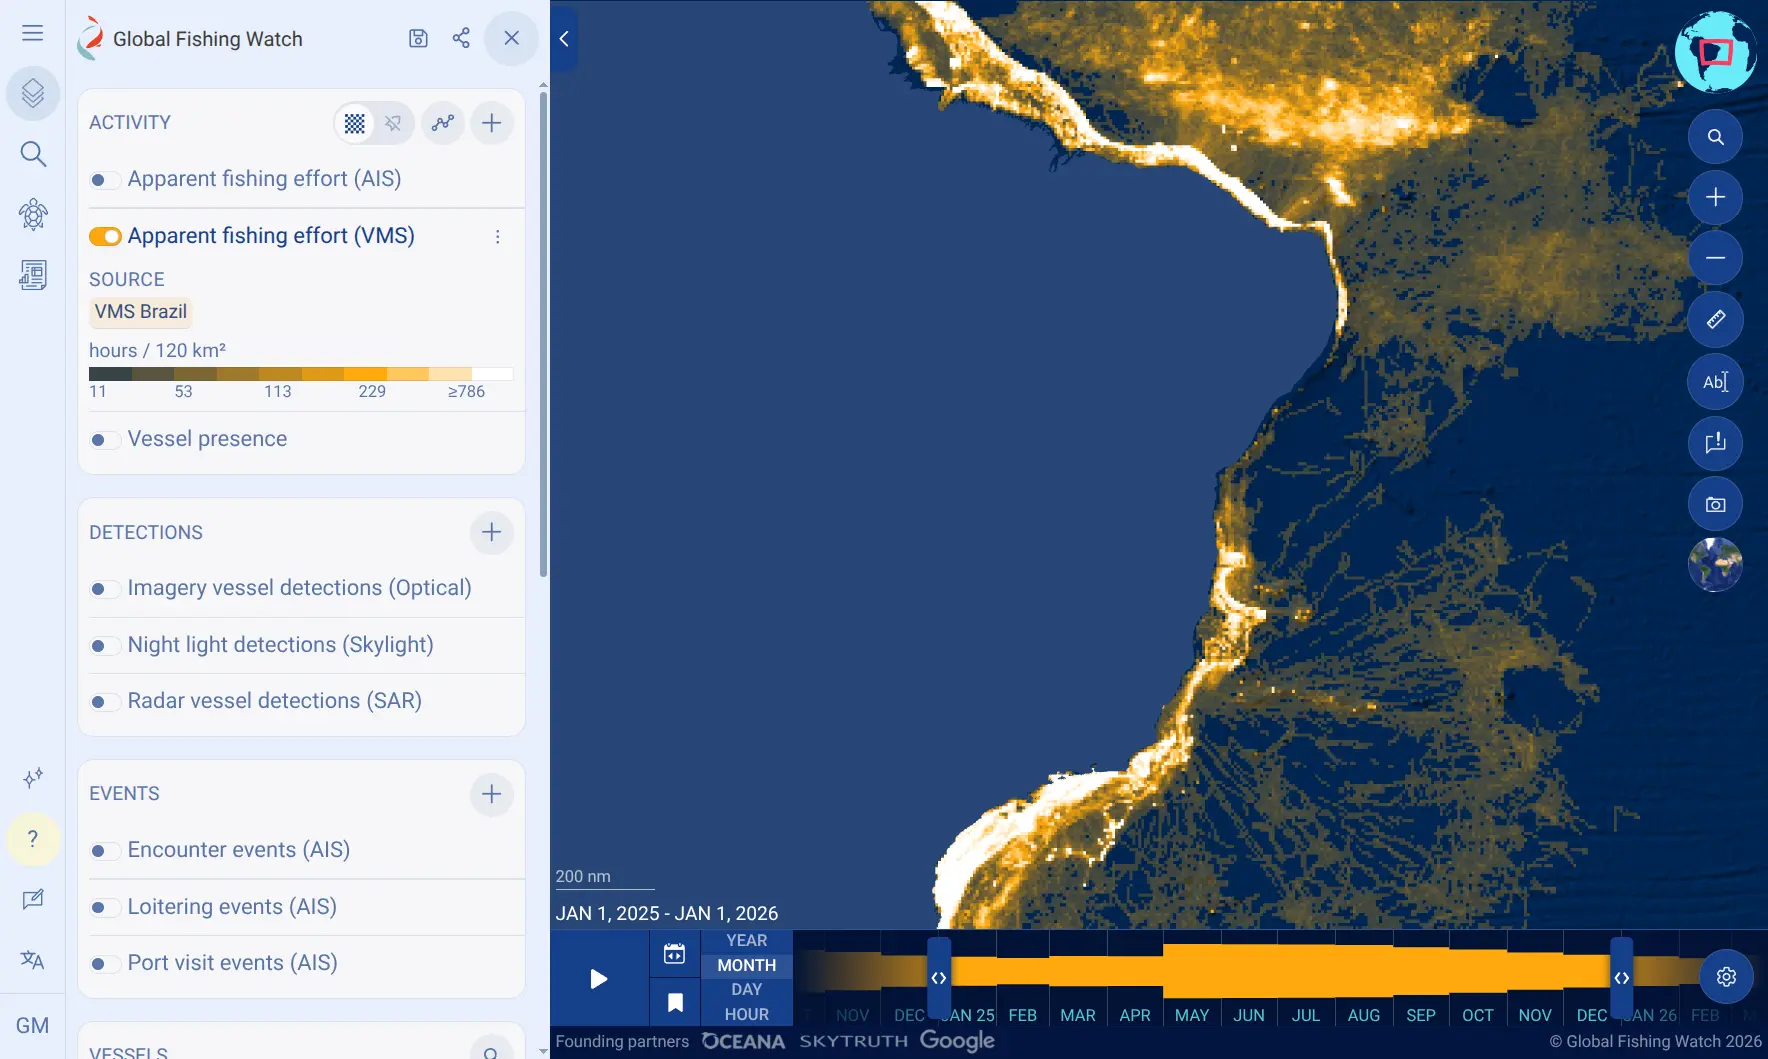
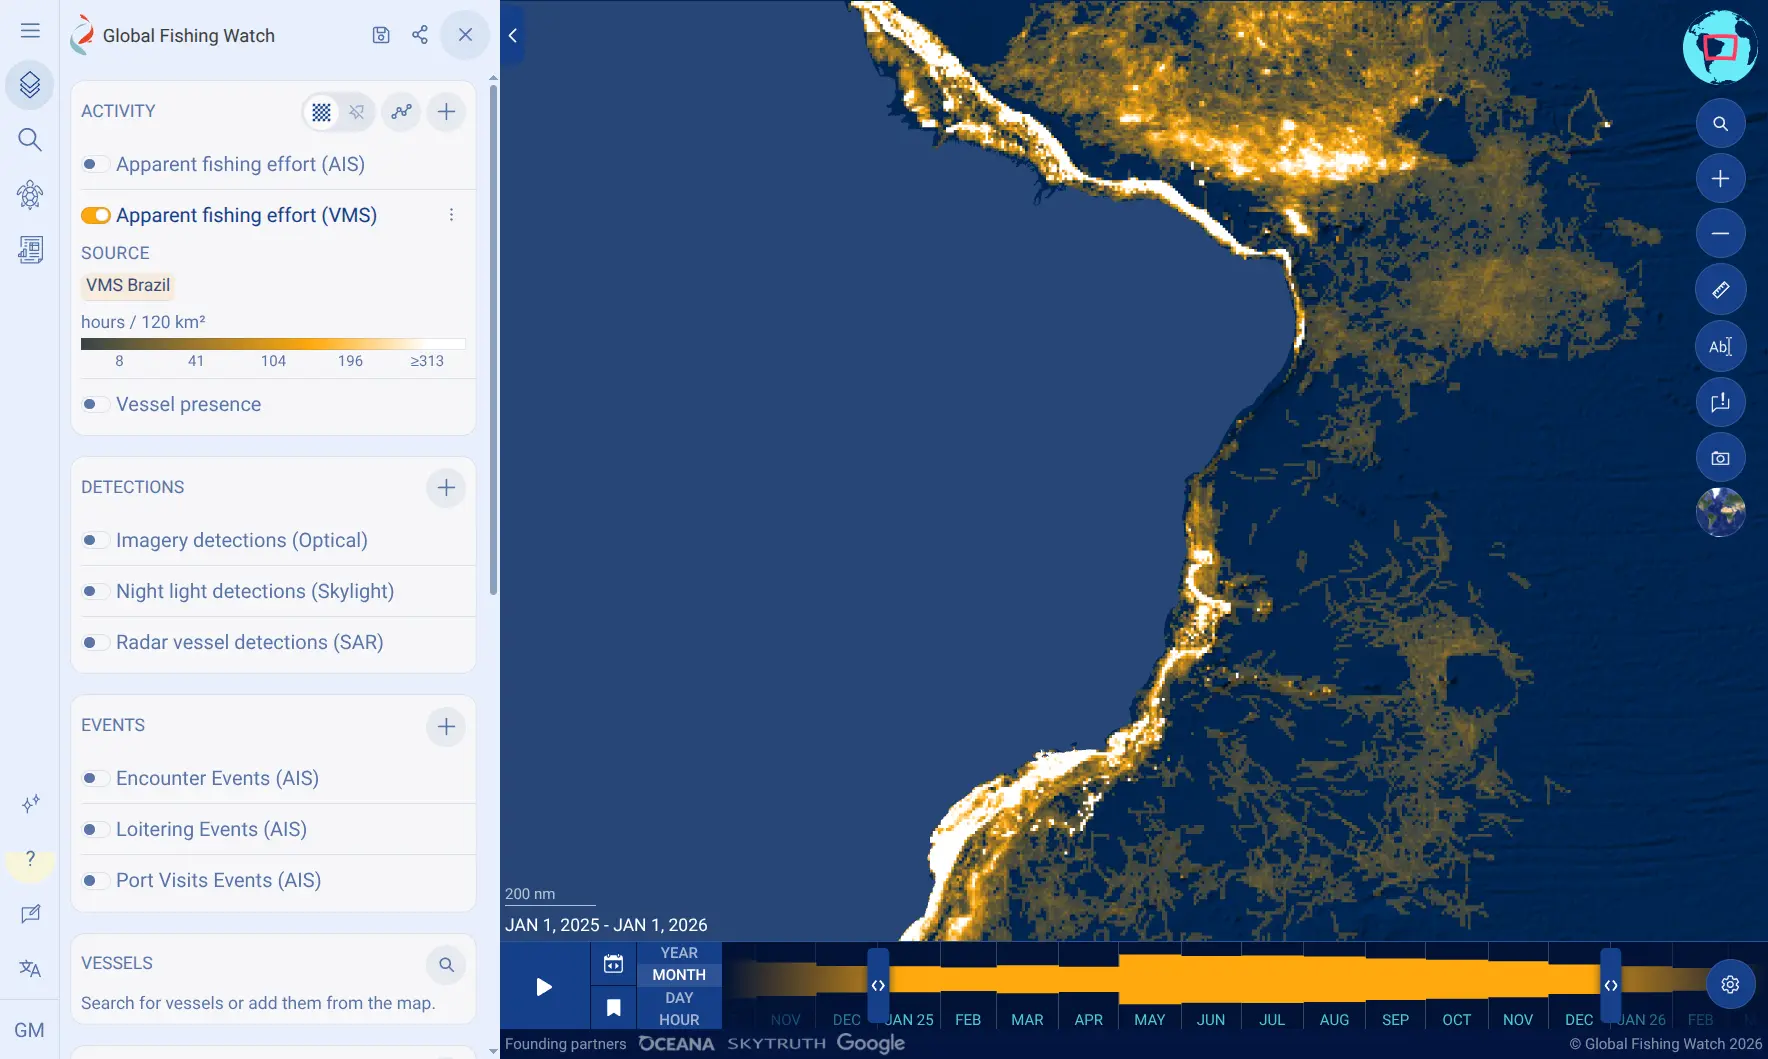
Some vessels that were incorrectly shown fishing while in transit now appear as non-fishing on those trips. For example, VMS data near Brazil.
| Pipeline version 4 | Pipeline version 5 |
|---|---|
 |  |
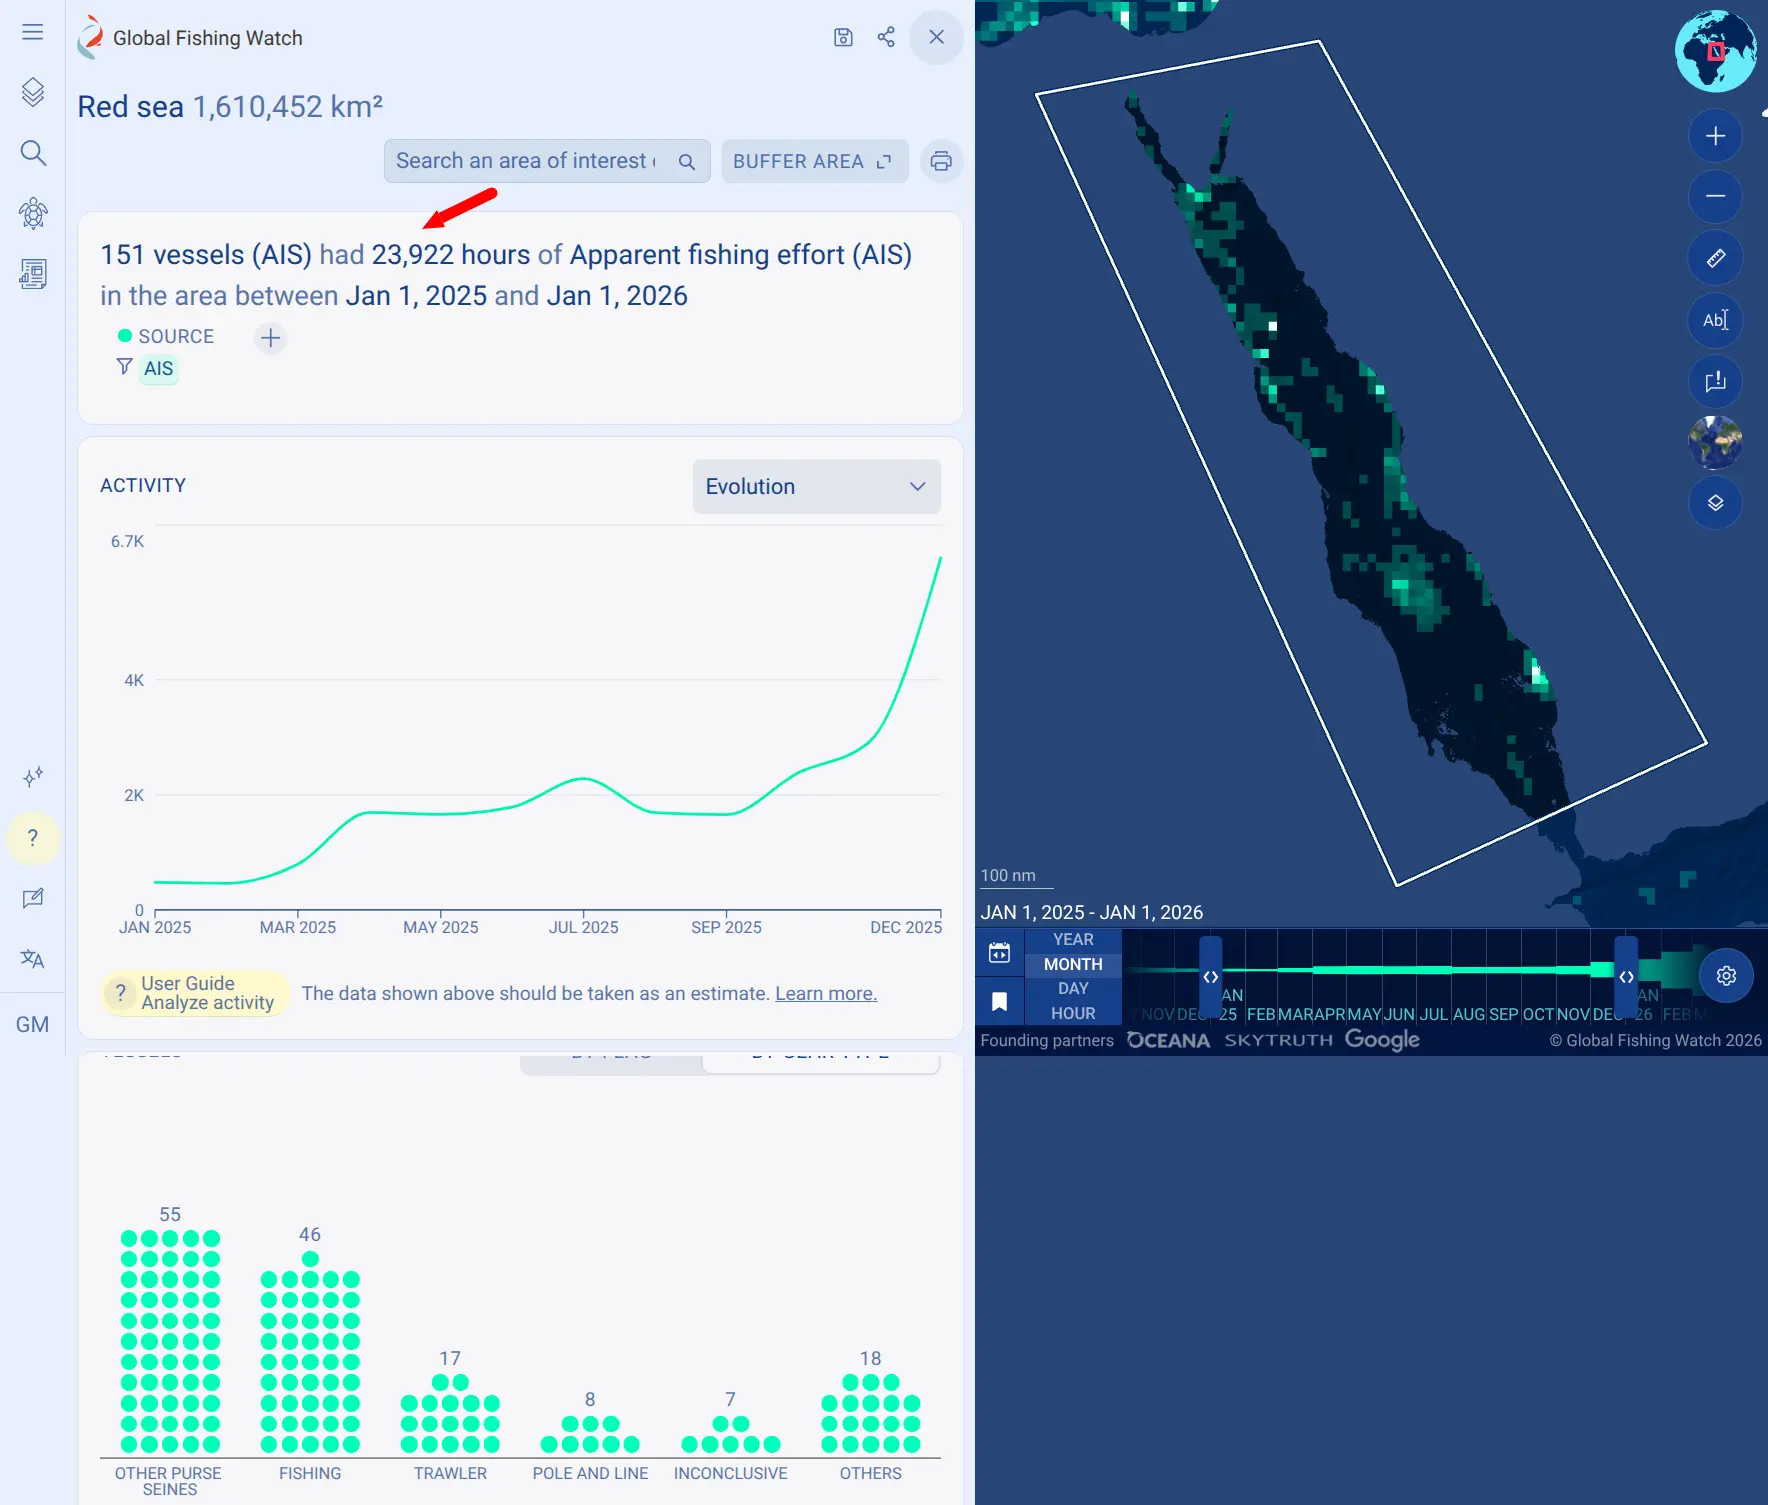
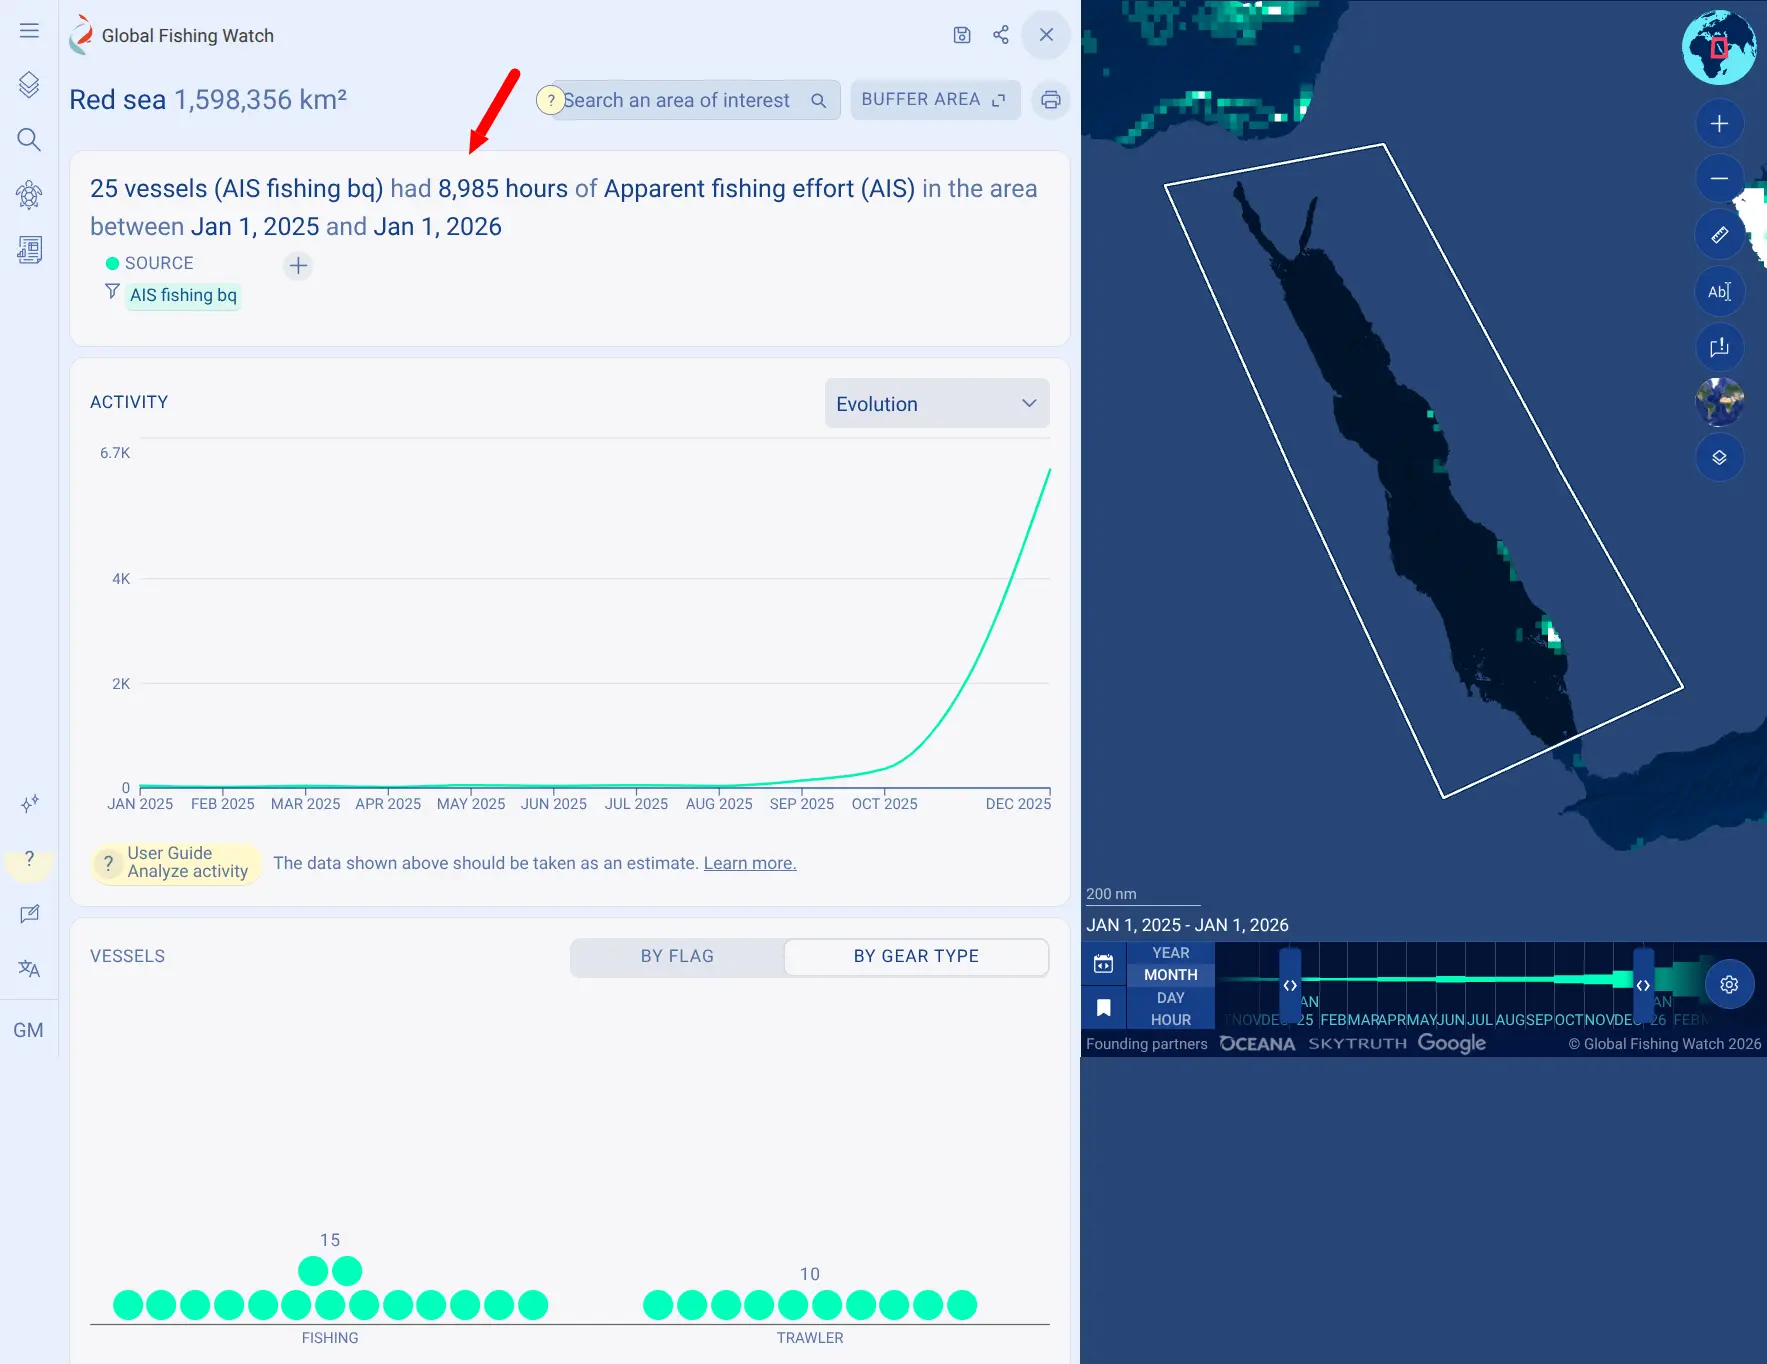
Apparent fishing activity is recorded only for vessels categorized under a fishing vessel type. Therefore, vessels classified as fishing vessels in Pipeline version 4 that have been reclassified as non-fishing vessels reduce the overall activity estimate. In the Red Sea, recorded fishing activity fell from approximately 23,900 hours (across 151 vessels) to roughly 8,900 hours (across 25 vessels).
| Pipeline version 4 | Pipeline version 5 |
|---|---|
 |  |
What this means for users
- In some areas, Pipeline version 5 reflects fewer total fishing hours, particularly near ports and along shipping routes. When comparing these results with earlier analyses or reports, a portion of this decrease stems from corrected model estimates rather than an actual decline in fishing activity.
- Although false positives show a clear overall reduction, the new general model may still incorrectly remove previous apparent fishing activity or retain existing false positives in certain cases. Previously generated results or workspaces should therefore be reviewed using the updated dataset.
AIS-based apparent fishing events
Changes to apparent fishing events are in line with changes in apparent fishing activity; both datasets apply the same fishing vessel filter and are based on the new general fishing detection model. Apparent fishing events include a substantial removal of short events — those less than 60 seconds. About half (52 percent) of apparent fishing events in the 20–24 minute length band were removed. The new model implements a 10-minute thinning protocol (previously five minutes), making short events harder to detect. Events in ports are largely reduced, consistent with the reduction of estimates of fishing in port. At a vessel track level, changes in apparent fishing events reflect changes in fishing model predictions. Trawlers’ predictions, which now distinguish haul-to-haul transitions, tend to present more events of shorter median duration and distance, while a drifting longline’s setting is now appropriately identified which results in events of higher median duration and distance.
AIS-based encounters events
Changes to encounters result from updates to our port and anchorages dataset. These updates affect the noise filter we use to remove events that occur within a set distance from ports (distance_from_port_m < 10000 ). The previous list of anchorages was missing a port at 26.5 degrees north, 50 degrees east (Al Qatif, Saudi Arabia), which was built in 2023 and led to more than 1 million “encounters” (mostly Fishing <-> Fishing) which have been removed in Pipeline version 5.
AIS-based loitering events
We did not change how we calculate loitering events. However, these events are affected by the updates to our spatial measures. Particularly distance from shore which are used to filter events.
The loitering events in our APIs and map are filtered to give a more conservative estimate of loitering. We remove “noisy” events and only include events with an average distance from shore of at least 20 nautical miles (avg_distance_from_shore_nm >= 20). Because the spatial measures grid changed, events close to the 20 nautical mile limit may now fall on the other side of it. As a result, some loitering events south of coastlines no longer appear, while some north of coastlines are now included. Overall, the distance-from-shore filter combined with the updated grid results in a 0.25 percent decrease in loitering events.
AIS-based port visits
The majority of added port visits are due to updates to our port and anchorages datasets. More port visits are observed in Vietnam (+83 percent), Chile (+13 percent), Brazil (+2.5 percent), Kenya (+10 percent) and Saudi Arabia (+4.3 percent).
Examples of changes you may notice on AIS-based events
Each data pipeline release includes an extensive quality assurance and review period, including an impact analysis of any data prototype, dedicated review by our QA analysts, and an internal staff review in a testing environment. As part of this process, Global Fishing Watch analysts compared Pipeline version 5 with version 4 across dozens of regions, fleets and datasets. To view the version 4 data, follow these instructions.
⚠️ IMPORTANT CAVEAT: The cases below are examples only. See more details here.
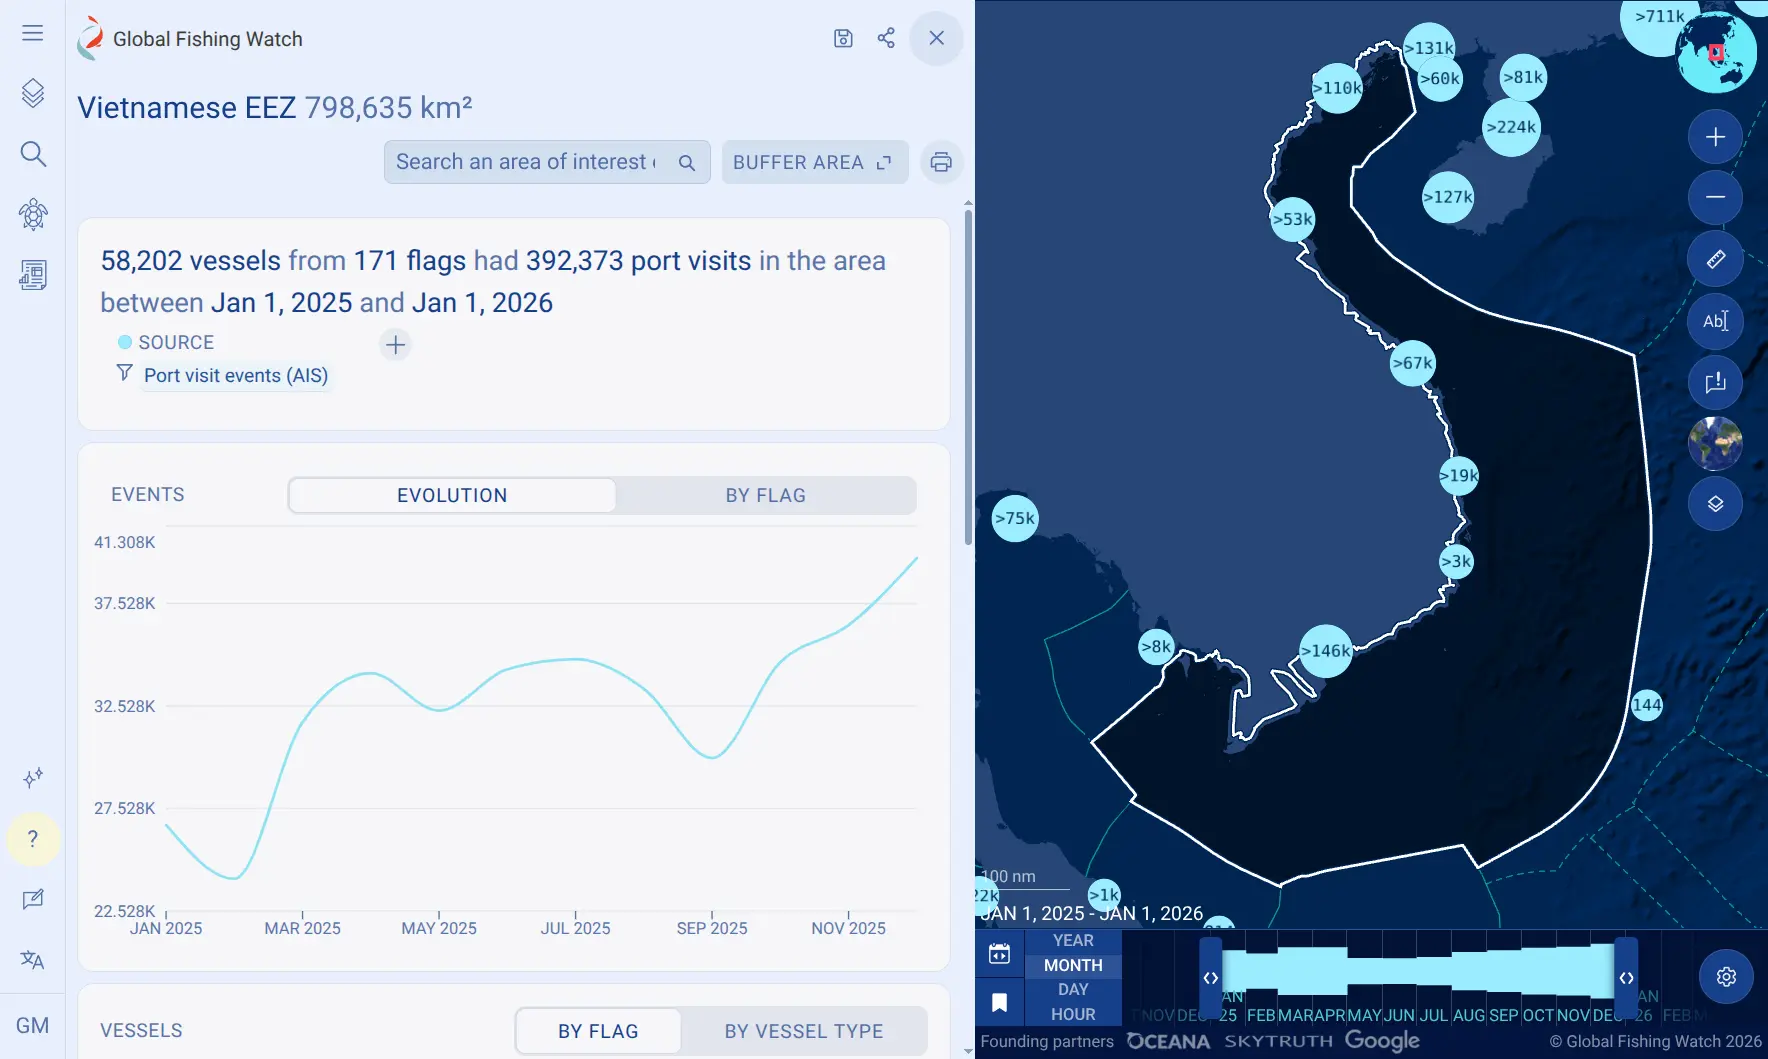
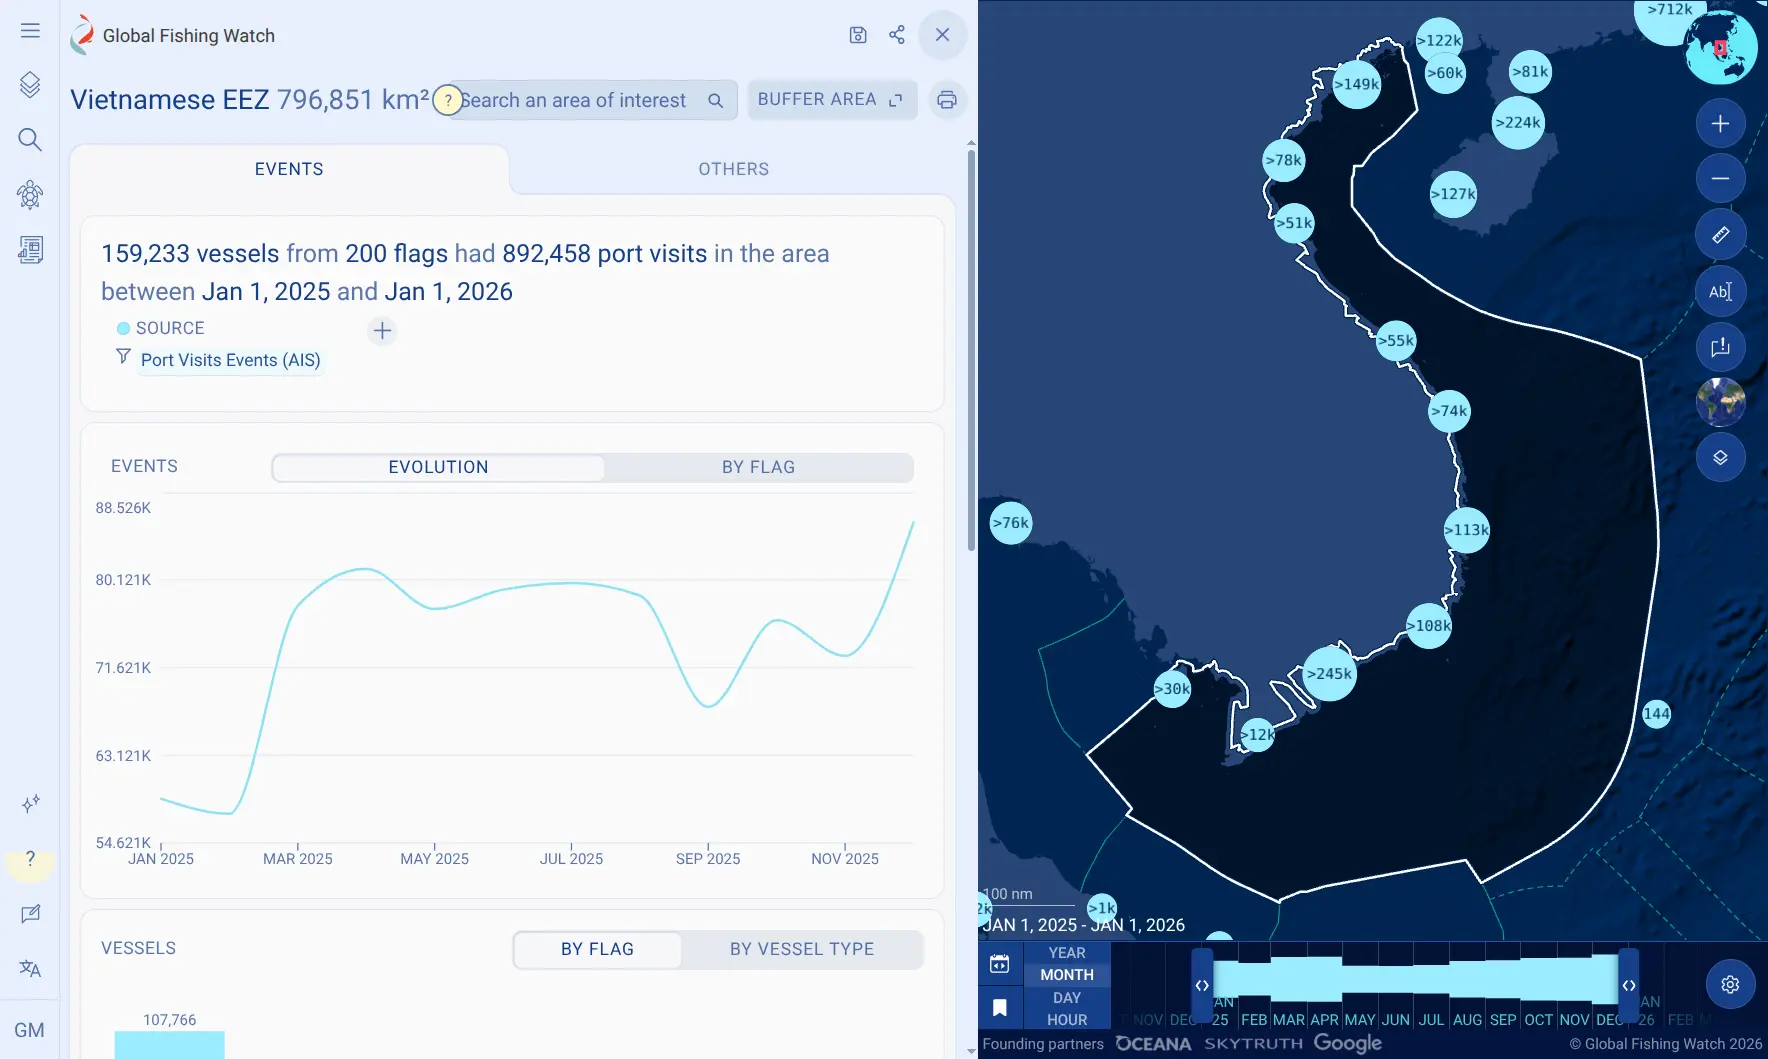
Example: Vietnam. Pipeline version 5 adds 5,366 new anchorages (see port and anchorages section), which help detect port visits previously missed. Within Vietnam’s EEZ, Pipeline version 5 records 892,458 port visits, compared with 392,373 in Pipeline version 4 an increase of approximately 127 percent. Vietnam accounts for most of the port visits added in this release.
| Pipeline version 4 | Pipeline version 5 |
|---|---|
 |  |
How these data changes affect our products
As of Oct.21, 2026, these changes apply to:
- The map, Marine Manager and Vessel Viewer.
- Public APIs, gfwr (R package) and Python package.
- Data download portal.
APIs and packages
- New API dataset version
v5.0and the aliaslatestpoint to v5.0 since Oct. 21, 2026.- Pin v4.0 in your code if you need to reproduce earlier results. Version 4 will remain available as a static dataset (without daily updates) until April 2027.
- 4wings API:
- When retrieving information using
public-global-fishing-effort:v5.0API dataset, the system returns updated data generated by the new general fishing model, filtered by fishing vessels identified under the updated vessel classification model.- Note on terminology: With Pipeline version 5, Global Fishing Watch is transitioning from the term
fishing efforttofishing activity. However, the API dataset name will retain “effort” until Pipeline version 6. More details are available here.
- Note on terminology: With Pipeline version 5, Global Fishing Watch is transitioning from the term
- For AIS
presencepublic-global-presence:v5.0,whentemporal-resolution = HOURLYand queries are grouped byvesselorMMSI, the response now includes speed data.
- When retrieving information using
- Events API:
- These new API datasets were created:
public-global-fishing-events:v5.0public-global-loitering-events:v5.0public-global-encounters-events:v5.0public-global-port-visits-events:v5.0public-global-gaps-events:v5.0: a new API dataset version was created for consistency but includes the same data as version 4.
- Updated regions are included in the response.
- These new API datasets were created:
- Vessel API:
- Added new API dataset
public-global-vessel-identity:v5.0. - Added new fields as part of the
combinedSourcesInfo.shiptypesresponse. - Maintained Vessel IDs between Pipeline versions 4 and 5.
- Added new API dataset
- Insights API
- Added new API dataset
public-global-vessel-insights:v5.0.
- Added new API dataset
- gfwr and Python package: Effective Oct. 21, 2026, both packages return data from the updated general fishing model and all Pipeline version 5 datasets.
- For additional details on API changes, visit the API Portal.
Global Fishing Watch platform
| Activity | Detections | Events |
|---|---|---|
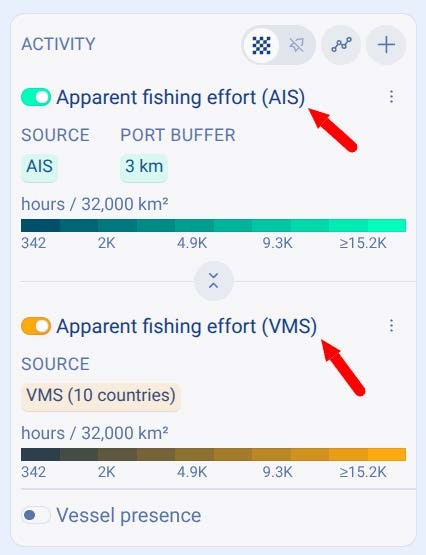 | 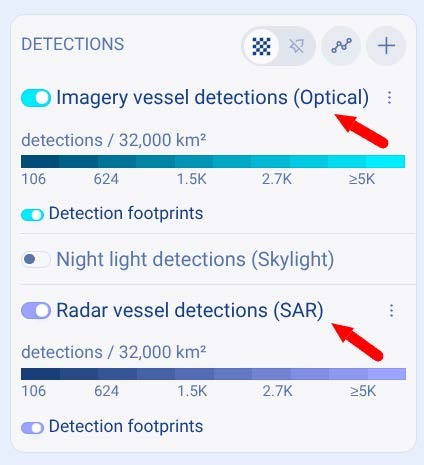 | 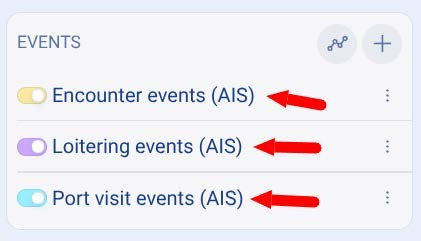 |
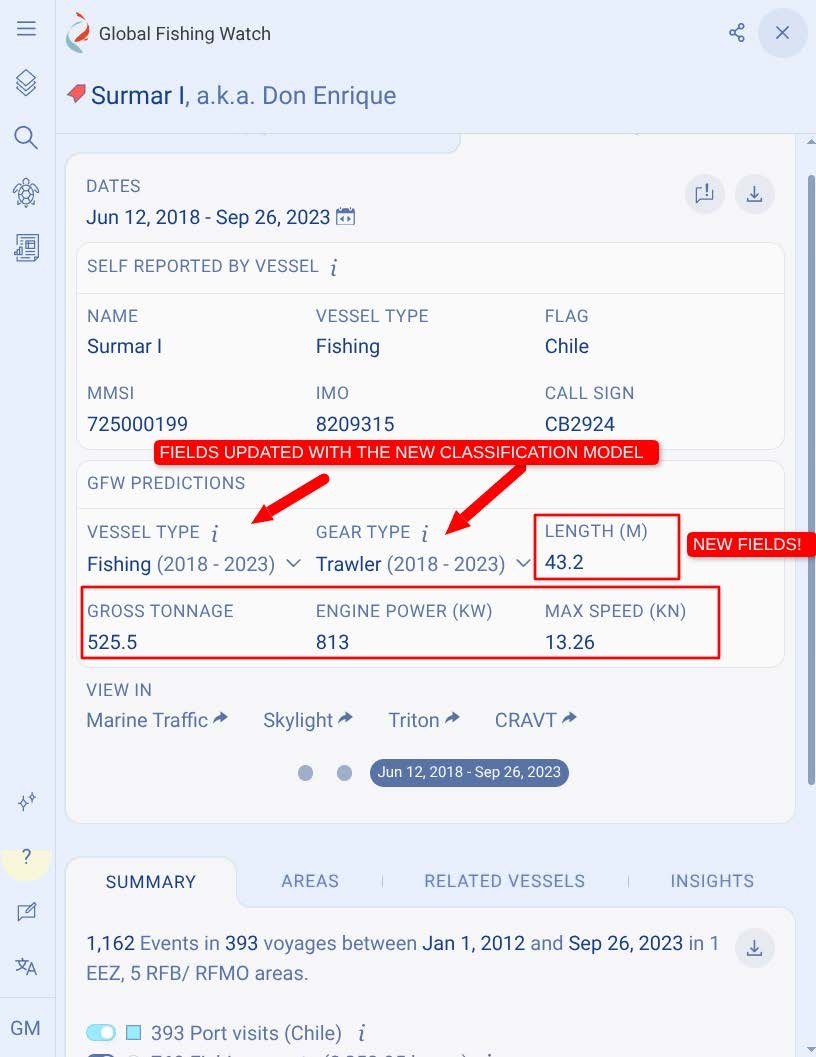
Vessel Viewer impacts
- The main data changes when reviewing a vessel profile are the Global Fishing Watch AIS source tab and classification model based estimations for:
- Vessel type
- Gear type
Visit this page for further data impact details.
- New fields have been added as part of the new vessel classification model for:
- Length
- Gross tonnage
- Engine Power
- Max speed
Data download portal (DDP)
- Port and anchorages: A new version of the DDP port and anchorages dataset with Pipeline version 5 anchorages was added.
- Voyages: A new version of Vessel voyages confidence 4 dataset was added, as it is affected by Pipeline version 5 anchorage and port visits updates.
- SAR vessel detections: Effective Oct. 21, 2026, SAR detections align with Pipeline version 5 data and incorporate the updated vessel classification categories.
- Sentinel 2 vessel detections: Effective Oct. 21, 2026, Sentinel-2 vessel detections match AIS Pipeline version 5 data.
Next steps and timeline
- Pipeline version 5 data is available effective Oct. 21, 2026. Version 4 data is available for review as static datasets and are no longer updated daily (see instructions).
- The next pipeline update is planned for June 2027.
For questions regarding this release or Global Fishing Watch products, contact [email protected]. Feedback on our data can be submitted through the following channels:
- Public feedback board: Submit feedback or vote on feature, API and data requests via the Global Fishing Watch feedback board.
- In-platform tool: Access the built-in form in the left sidebar of the map on the Global Fishing Watch platform.