
Datasets and Code: Apparent Fishing Activity
Global Fishing Watch’s flagship dataset is apparent fishing activity based on transmissions broadcast using automatic identification system (AIS) and vessel monitoring systems (VMS) shared by country partners. In 2018, we published the first global assessment of commercial fishing activity in the journal Science. Our research found that fishing is both widespread — occurring throughout approximately 50 percent of the ocean — and highly concentrated, with more than half of fishing activity occurring in just 0.5 percent of the ocean.
Each day we receive millions of AIS- and VMS-based vessel positions and identity messages. As a result, we continually improve our technology and algorithms to enhance our ability to monitor global commercial fishing. Our dataset, which dates back to 2012, can be explored on our map, accessed through our public APIs and packages or downloaded from our data download portal.
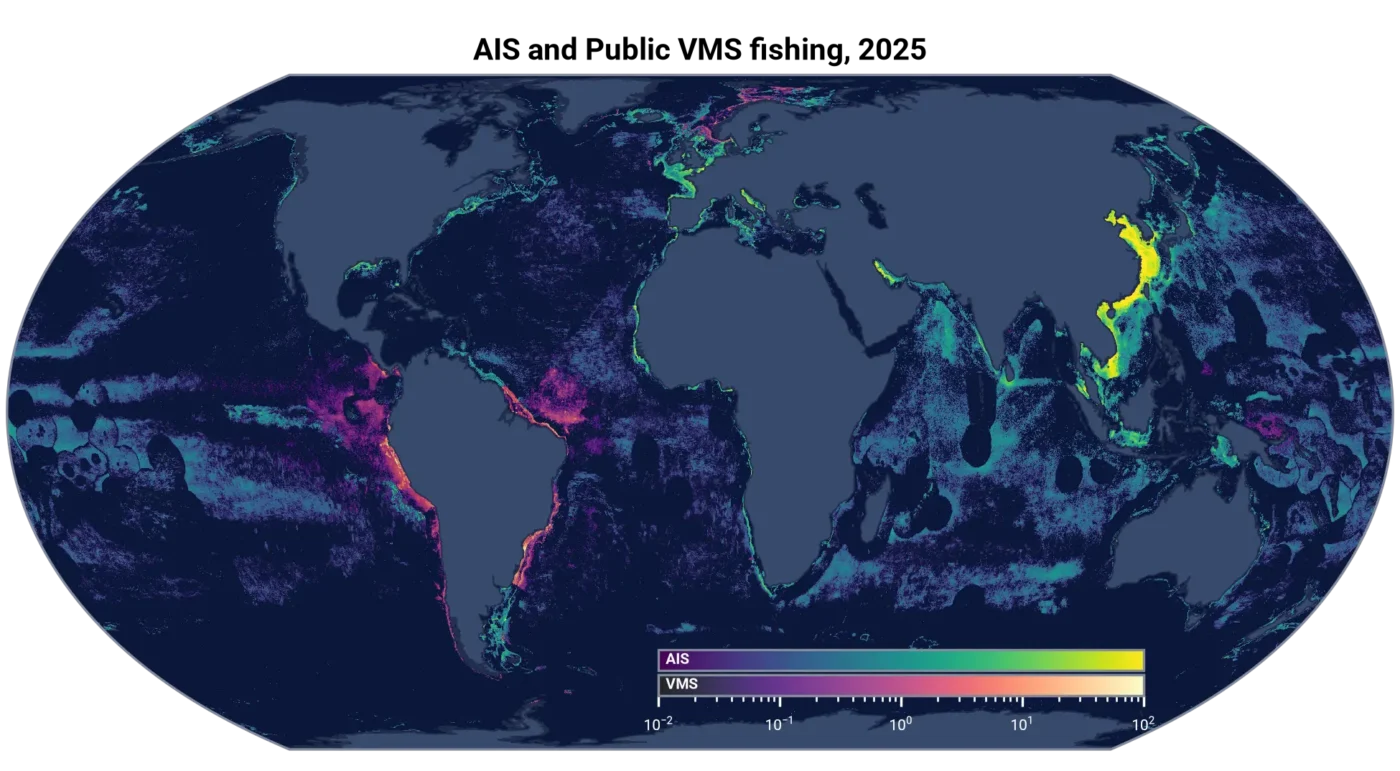
Detecting apparent fishing activity
The fishing model pipeline uses vessel tracking data from AIS and VMS to classify apparent fishing activity. The model analyzes sequences of vessel positions and associated features, including speed, bathymetry, relative location and distance from shore. It uses vessel movement patterns over time to predict a fishing classification at each position. The apparent fishing activity displayed on the map, generated by the general fishing model, classifies each position as fishing or not fishing.
We have trained our model using thousands of vessel tracks labeled by experts. When our fishing detection model scores an AIS or VMS position as a fishing position, the time associated with that position is considered apparent fishing activity.

Apparent fishing activity in products
Our estimates of apparent fishing activity go hand-in-hand with our vessel classification model. For vessels classified as fishing, we provide apparent fishing activity in several formats.
At the vessel level, classifications can support compliance efforts, such as identifying whether a specific vessel’s apparent fishing activity occurs inside a non-take marine protected area, outside of an authorized fishing season or in a location in which the vessel lacks authorization to fish.
We also estimate apparent fishing events to make sequences of consecutive apparent fishing positions easier to visualize. These events group consecutive positions into summaries of apparent fishing activity. Then, we apply additional processing steps, including filters based on time, distance and vessel behavior, that may exclude some fishing positions. As a result, apparent fishing events and apparent fishing activity may differ, especially when fishing activity is spread out over long distances or separated by substantial time gaps. The apparent fishing events methodology documentation provides further details on how these calculations differ.
When aggregated across vessels and summarized by area and time period, these estimates produce what we call apparent fishing activity: the total estimated fishing hours across vessels within a given area and time range. This information is visualized on our platform as a fishing intensity heatmap.
Caveats and limitations of satellite data
AIS and VMS data do not provide a complete picture of global fishing activity for several reasons. For instance, AIS data cover only a small fraction of the world’s estimated 3.3 million fishing vessels. And while the International Maritime Organization mandates AIS for most vessels larger than 36 meters, smaller vessels may not appear in AIS data. Moreover, vessels broadcasting AIS are predominantly from upper and upper-middle income countries. VMS data are provided by country partners through formal agreements and on a case-by-case basis.
At the same time, not every satellite message broadcast is recorded. A receiver must be within range to record a message, so satellites must be overhead or dynamic receivers — one carried onboard vessels — must be nearby. Terrestrial receivers also capture AIS signals, but only near shore. Additionally, satellite messages can interfere with each other in areas of high vessel density and AIS devices vary in broadcast strength and frequency. As a result, fewer satellite positions may be received from vessels operating in certain parts of the world. These gaps can limit the effectiveness of our machine learning models and our ability to detect apparent fishing activity.
For details on model performance and data caveats, refer to the fishing model details.
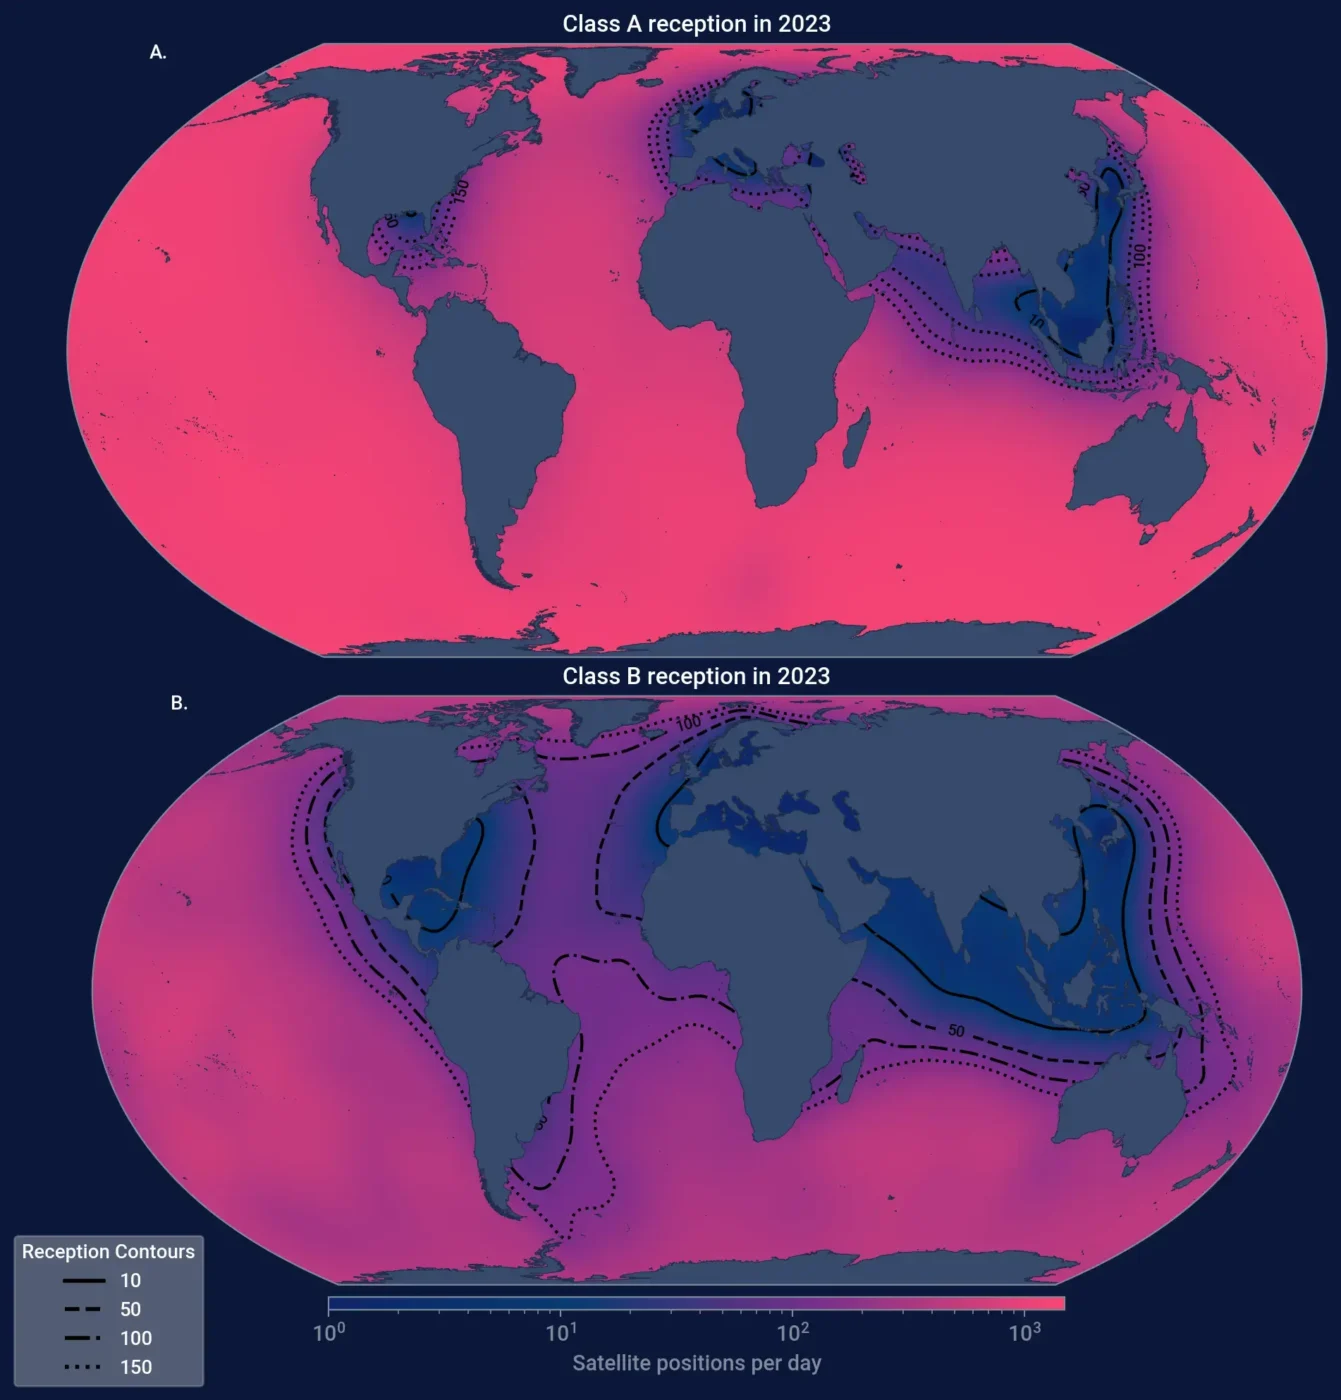
Changes in data coverage also affect observed trends over time. As more vessels have adopted transmission devices and more receivers have begun recording messages, the amount of activity captured in the satellite datasets has increased. The rise in activity partially reflects data reception and should not be automatically interpreted as an increase in apparent fishing activity, although increases may have occurred in some areas.
Around 2022, we began receiving data from dynamic AIS receivers carried onboard vessels. This additional data source substantially improved our reception of AIS messages in some areas of high vessel density, particularly in the waters around China and Southeast Asia. Increases in apparent fishing activity should be interpreted in light of these changes.
License
Global Fishing Watch data is licensed for non-commercial use only. The site and the services are provided for non-commercial use only in accordance with the CC BY-NC 4.0 license. If you would like to use the site and/or the services for commercial purposes, please contact us at [email protected].
Access our data
Data on apparent fishing activity is available through several Global Fishing Watch tools:
- Global Fishing Watch Map: Explore near real-time apparent fishing activity derived from AIS data.
- APIs and packages: Access apparent fishing activity data programmatically through the Global Fishing Watch 4Wings API, as well as the gfwr package for R users and the Global Fishing Watch Python package. These tools provide access to the same data available in the Map.
- Data Download Portal: Download historical datasets, associated metadata and documentation describing model versions, coverage and classification accuracy. Unlike the continuously updated map and APIs, data available through the portal represents periodic static snapshots.
Each tool offers access to different components of the apparent fishing activity dataset. To determine which tool best fits your needs, refer to our data availability guide.