Based on a lengthly review of refrigerated cargo vessels, we have just updated our transshipment data. You can read about the update here or download the slightly updated report and data here. The overall story of transshipments, as Nate notes in this post, is unchanged.
This is a very rich dataset, giving the time and duration of thousands of potential vessel rendezvous across the globe. One thing I was curious about was how transshipments vary in time. Are transshipments more common in one month than another? Using this ipython notebook, I explored some of the temporal patterns in our data. The annimated gif below shows our potential rendezvous for every month in 2016.
Some interesting patterns: Reefers are active off the coast of Argentina mostly during the first half of the year; transshipment behavior moves north and south off the coast of Peru, likely following the Chinese squid fleet; transshipment appears to be most common in the winter months in the Sea of Okhotsk in Russia (cold!); and transshipment off the coast of Japan appears to be most common between May and October.
Visualizing this another way, we can sum the loitering behavior of reefers by latitude and see how it varies by time:
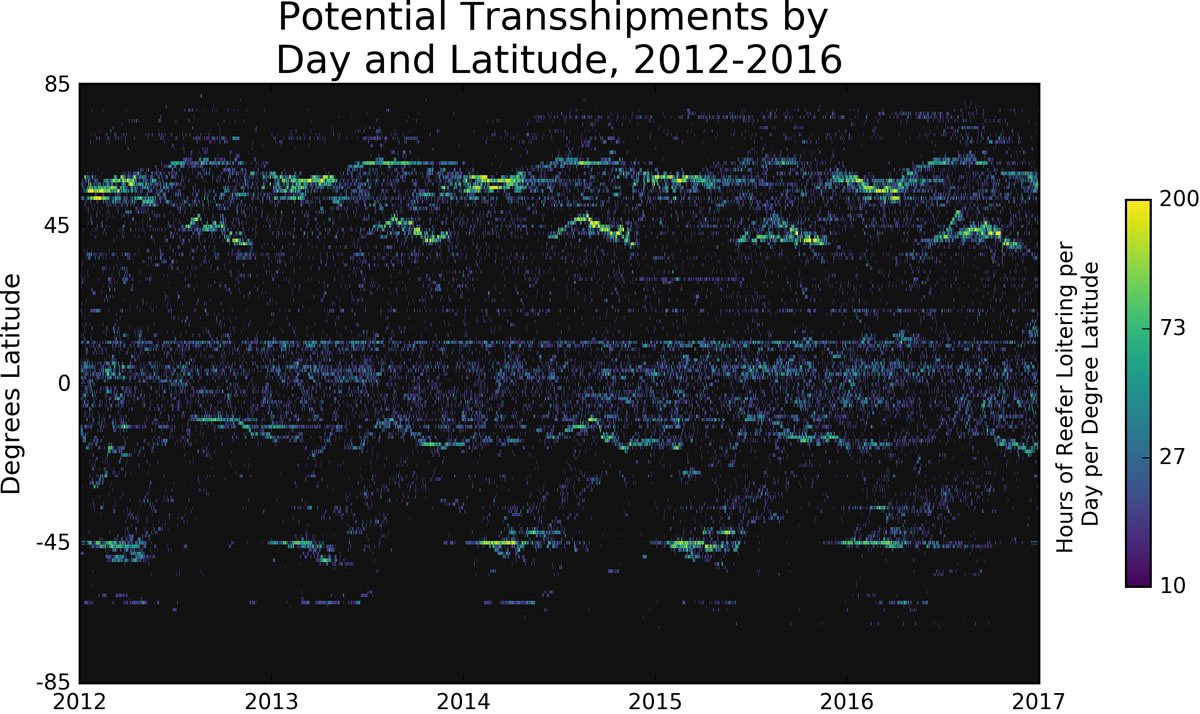
The seasonal “heatbeats” of transshipment are visible in the northern and southern hemisphere, while equatorial transshipment appears, unsurprisingly, to be more constant in time. Download the datayourself and take a look.