Satellite radar imagery and machine learning provide new method to fill gaps in monitoring pelagic longline fleets
Since 2014, Global Fishing Watch has processed automatic identification system (AIS) data to detect vessels around the world and reveal their fishing activity on its online map. But not all vessels broadcast their GPS positions using this tracking technology, leaving an unknown number of vessels undetectable and creating blind spots in the organization’s flagship tool.
To help fill these gaps, we turned to satellite imagery. In the past decade, hundreds of earth-observing satellites have been launched. We recently used images captured by one of these satellites to conduct a pioneering study that demonstrated the potential value of these aerial photographs in monitoring what might be the most elusive fishing fleet in the world—the pelagic longline fleet.
We focused our study on this fleet because it is one that could benefit from more transparency of its activities. Only about 1 out of 20 longline vessels has an on-board observer to help verify its reported catch and bycatch, or species that are unintentionally caught. Bycatch is a serious problem—longlines may be responsible for the bycatch of over 100,000 seabirds each year, and they are also likely pushing down shark populations around the globe. Fish and seabirds are not the only ones at risk, as more than half of drifting longline vessels are also predicted to be at risk of using forced labor, suggesting that thousands of fishers could also benefit from better oversight of this fleet.
Monitoring exactly where these vessels operate will not fully address sustainability challenges, but they are an important first step to creating transparency in their activities. A major challenge in monitoring the longline fleet is the fact that it operates across such a vast area. The global longline fleet consists of a few thousand vessels, each of which sets a line of hooks that can be up to 100 kilometers long. In a given year, they set their hooks in about one-third of the global ocean—an area only slightly smaller than the total combined area of land on the planet.
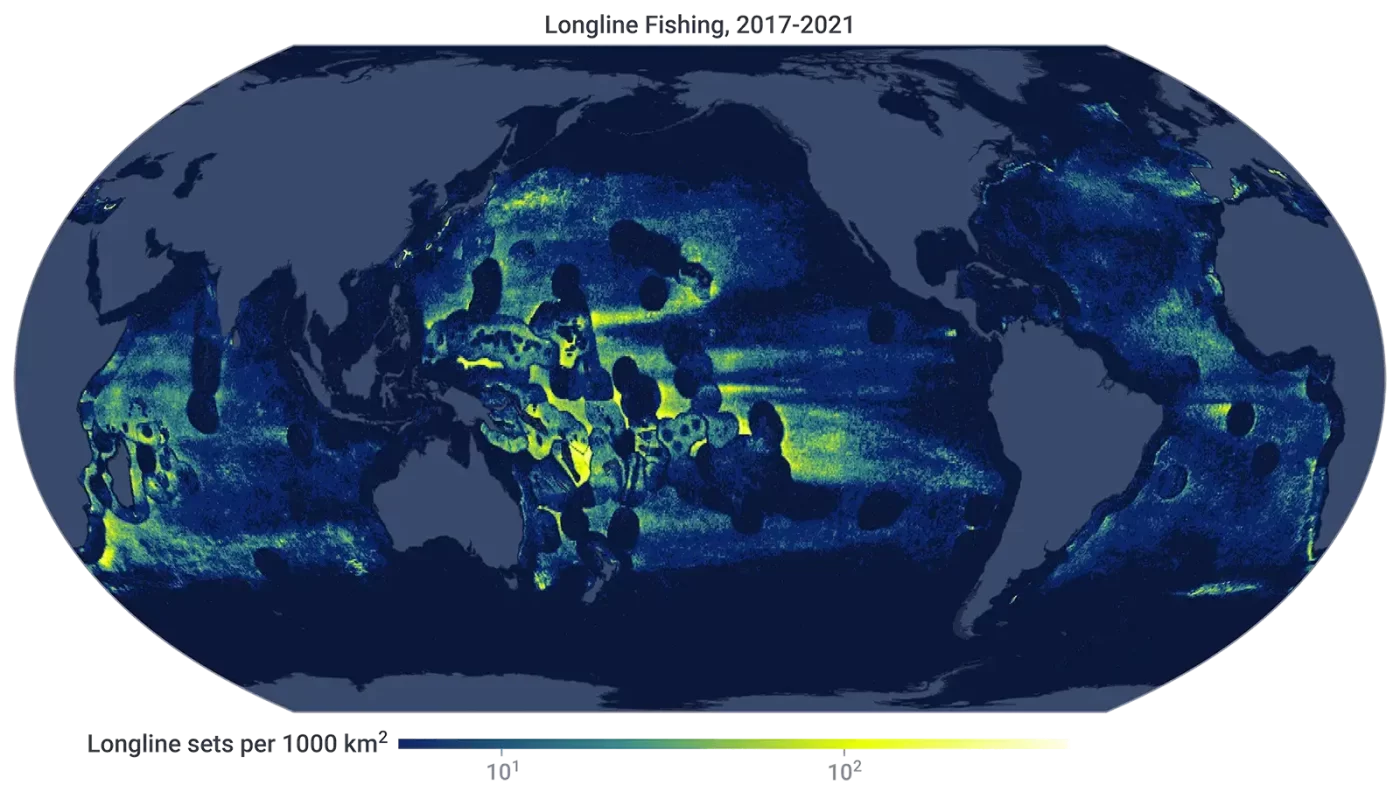
While an immense area to try and monitor with satellite imagery—an approach with its own technical challenges—we found that longline fishing is actually quite concentrated. About half of longline activity occurs in much smaller regions, sometimes focused along political boundaries in the ocean, and is seasonal in nature, making the fleets easier to follow.
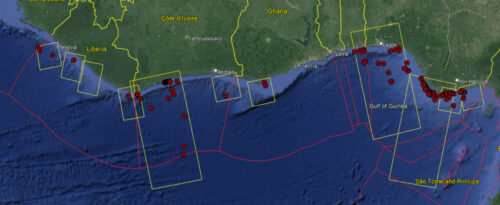
We drew on imagery created by radar, in which satellites send radio waves to the ocean and create a picture of what is on the water by listening to the echo that bounces back. We obtained these images for two regions: an area north of Madagascar in the Indian Ocean and another between Kiribati and French Polynesia in the Pacific Ocean. Both are areas of intense longline activity, but at the time, the number of vessels operating within them was unknown.
By analyzing the imagery and using statistical methods, we determined that about 35 percent of the longlines operating north of Madagascar and about 10 percent of the longlines operating in the high seas between Kiribati and French Polynesia were not broadcasting their GPS positions over AIS. As a result, we have a clearer picture of the total amount of fishing happening in these regions, which can lead to more informed estimates about the catch and bycatch generated by these vessels.
Interestingly, the “dark” vessels–those not publicly broadcasting their location or appearing in public monitoring systems–were operating in roughly the same locations as those that were broadcasting AIS, which allowed us to conclude that there were no large dark fleets operating illegally across boundaries. Our AIS data in those areas corresponded with the actual patterns of fishing activity, even if some vessels were missing from the AIS data.
Overcoming technical challenges in data fusion
This work represents a big advance in how we can combine data from satellite radar and AIS, a practice we call “data fusion.” Unfortunately, this fusion is not always easy.
AIS data provides GPS positions of vessels that are actively using their tracking device, but these messages are not always regularly spaced—and sometimes they are not received at all. The rate at which vessels broadcast their location ranges from every few seconds to several minutes, and not all messages make it into the satellite database because of poor satellite reception and the fact that satellites are not always overhead. This can result in gaps of minutes or sometimes even hours between recorded GPS positions. After processing a satellite radar image, we have coordinates of where we think vessels are, a rough estimation of how big each one is—and we know when the image was taken. We then have to decide which of the detections match up to vessels broadcasting AIS and which ones are classified as dark vessels.
These challenges led us to explore other ways to match vessels using AIS and satellite radar detections. One method we implemented was using historical AIS data to figure out how vessels move—by doing this we could assign a probability that a given vessel in AIS matched to a given vessel detected by satellite radar.
The next technical challenge was even more difficult to overcome. How could we determine the number of vessels operating when they were undetectable to both AIS and satellite radar? While we’ll never know for certain, we can make estimates by doing some detective work and using probabilities. To start, satellite radar data estimates the lengths of vessels. And we can also determine how likely a vessel is to be detected by SAR from the AIS data. We found that vessels around 20 meters in length were only seen about 20 percent of the time with the type of radar we used, while vessels 50 meters long were seen almost all of the time. So, if we saw 20 dark vessels in the radar data that were estimated to be about 20 meters long, most likely there were many more—perhaps 100—that had gone undetected. By developing such statistical methods, we were able to estimate the likely number of longline vessels present in each region.
We were also able to show how these methods could be applied globally–our ultimate goal. If the dark longline fleet follows similar patterns of the fleet broadcasting AIS, which our paper suggests, then we should be able to capture most of the dark activity by imaging the places where vessels with AIS are operating. To visualize the major areas of longline fishing with satellite radar, we will need only a few thousand satellite images per year. By comparison, if we were to try to image the entire ocean every week with this imagery, we would need hundreds of thousands of images.
Satellite radar has allowed us to see, and demonstrate, what is happening across the longline fleet for the first time. It has enabled us to develop new methods that can be scaled globally to monitor fishing activity across the world’s ocean, providing another tool to increase transparency of human activity at sea.
David Kroodsma is the director of research and innovation at Global Fishing Watch.