Just a few years ago the very idea of collecting billions of radio signals from ocean-going vessels all around the world and creating a global map of their activity in near-real time would have been unthinkable. But today’s cloud computing technology allows us to do amazing things with huge amounts of data.
Aaron Roan, a data scientist from Google and an analyst for the project, has been helping determine just what kind of information we can get out of satellite data from vessel Automatic Identification System (AIS) signals. One of the questions he asked a while back was, can this data tell us when a vessel is intentionally turning off its AIS broadcast? We think it can. It definitely can identify gaps in AIS broadcasts, and we’re working on singling out those that represent intentional actions by vessel captains. You can read about what it means for a vessel to “go dark” in our previous post, but we’d like to give you a little insight into how our analysts are processing the data.
To give a sense of what it takes, consider this: In mid-2015, satellites received over 450 billion AIS messages every month, and as more satellites go up, that number increases. Our analysts had to figure out how to determine which of the 450 billion signals form a track and which tracks contain a gap in time that has no signal. Then they had to weed out all the gaps that are most likely due to something else.
The first step in that process was to look at all of the signals or pings and identify individual vessels based on their Maritime Mobile Service Identity (MMSI) number. “Any time an MMSI stopped pinging for more than 24 hours, we called that a gap,” Aaron says. “Well, it turns out nearly every boat had a gap in transmission.” Such a broad picture of the data couldn’t tell him anything.
Sometimes getting data to talk is about knowing what questions to ask, so he worked with our fisheries experts and others on the team to identify features in the data that might be important. For example: vessels often turn off their AIS when entering port, so they pulled out all the gaps in AIS signals that occurred close to port.
“We also noticed that there are gaps all over the place off the coast of the South China Sea and during certain seasonal trends in certain areas.” It turns out there are many gaps in areas with lots of boats, because AIS signals can interfere with one another and overwhelm satellite receivers. Gaps in high-density areas were thrown out of the dataset, and our team kept looking.
“Satellite coverage was another concern,” Aaron says, because not every spot on the ocean has a satellite over it at all times. “So we rastered up where satellite does have coverage at any given point in time so that we will be able to lay it over the AIS data.” Think of it as a map of satellite coverage laid on top of a map of vessel tracks with AIS gaps in them. And remember, both maps are changing minute-by minute as satellites move and vessels continue to send messages. So the data has to be evaluated constantly through time. Aaron and the team then chopped the maps into blocks (5 degrees longitude by 5 degrees latitude) and filtered out gaps that occurred in blocks without satellite coverage.
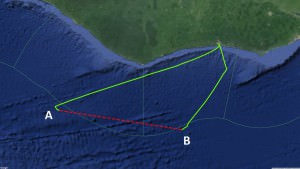
Now that Aaron has identified those three features to help whittle down the data (distance to port, vessel density and satellite coverage), the team is looking a little closer at vessel behavior. “We see boats that basically leave port, and the moment they hit the border between the exclusive economic zone [EEZ] and the high seas, the AIS goes off,” Aaron explains. “The next time we see them, maybe two weeks later, is right before they enter the EEZ on their way to port.” An example of this is evident from the vessel track below.

Those are gaps that clearly suggest intention on the part of vessel captains. Likewise, it will be useful to look at gaps when vessels transit through marine protected areas. If they’re intentional, they may warrant a closer look. That’s for someone else to decide.
For our part, the goal is to provide a view of what’s going on over the horizon to everyone who wants a better understanding of how commercial fisheries are using our shared natural resources on the oceans.
To date, we have successfully identified gaps, but our team is continually working to increase our knowledge about what they mean. In the near future, we will be able to say which gaps represent intentional efforts to “go dark.” Stay tuned. . .


