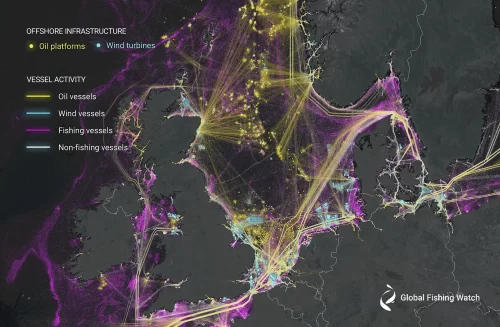
What is Global Fishing Watch?
Global Fishing Watch aims to create transparency, accelerate research and innovation, and promote sustainability in fisheries. Founded as a collaboration between Oceana, SkyTruth, and Google, Global Fishing Watch became an independent 501(c)3 organization in June 2017. Through our public mapping platform, we allow anyone to view global fishing activity in near real-time, for free, at the click of a mouse. Learn more.
Who are the Global Fishing Watch Research Partners?
We work closely with a number of leading research organizations to apply Global Fishing Watch data to advancing specific sustainability goals like expanding or creating new marine protected areas (MPAs) and exposing the scope of illegal, unreported, and unregulated fishing (IUU). These partnerships have also informed the development of Global Fishing Watch’s core technologies, including how we identify fishing behavior, transshipment, and suspicious activity at sea. Our research partners advise and assist with our own initiatives, providing intellectual guidance and using the outputs for their research. Learn more.
New Study in Science: “Tracking the global footprint of fisheries”
A new study by Global Fishing Watch and Research Partners, “Tracking the global footprint of fisheries,” was published in the journal Science this week. The research presents the first ever global dataset of fishing captured by satellites using automatic identification system (AIS) positions. The data reveals the global extent and frequency of fishing activity, both within countries’ exclusive economic zones (EEZs) and on the high seas, in unprecedented resolution.
Key Findings
- Although humans have been fishing the oceans for at least 42,000 years, we have been unable to clearly identify when and where we are fishing until now.
- Industrial fishing occurs in over 55 percent of ocean area — a spatial extent at more than four times that of agriculture, even though capture fisheries provide only 1.2 percent of global caloric production for human food consumption.
- Global fishing patterns have a strong response to cultural and political events such as holidays and weekends, but minimal response to short term economic and environmental variation. For instance:
- The Christmas holiday and fishing moratorium in China have a bigger effect on the global temporal footprint of fishing than any seasonal weather changes.
- The “price elasticity of demand” for fuel in the global fishing fleet is relatively low, meaning that when gas prices change, total fishing effort does not change very much.
- Five flag states (China, Spain, Chinese Taipei, Japan, and South Korea) account for more than 85 percent of observed fishing effort on the high seas.
Why are these findings important?
Such high resolution information on where global fishing occurs will allow for revolutionary improvements in ocean management. The dataset provides a powerful tool for ocean governance, in particular for the high seas beyond national jurisdictions where governance is currently poor. It can help governments, management bodies, and researchers to make transparent and well-informed decisions to regulate fishing activities and reach conservation and sustainability goals. The data reveal where certain management boundaries are, allowing us to observe which are effective. It is also evident that significant regions of the ocean are not heavily fished, and these areas may offer opportunities for low-cost marine conservation.
Why are these data revolutionary?
This study describes the global footprint of fishing activity at hundreds of times higher spatial and temporal resolution than previous datasets. Based solely on vessel movement patterns, the Global Fishing Watch algorithm processed 22 billion AIS messages to identify more than 70,000 commercial fishing vessels, the sizes of and engine powers of these vessels, what type of fishing they engaged in, and where and when they fished down to the hour and kilometer. This new high-definition global view of fishing would not have been possible without recent advances in computing power, an increase of satellites in orbit, and improved machine learning algorithms. Labeling the fishing activity by hand would have taken a fisheries expert working full time over a 100 years.
Over the course of 1 year our dataset captured…
-
- 40 million hours of fishing activity
- Vessels that consumed 20 billion kilowatt hours of energy
- Vessels that covered a combined track length of 460 million km, a distance equal to traveling to the moon and back 600 times.
Data Launch and Forthcoming Research
The authors of the study are making their dataset freely available to the public, allowing anyone to download, visualize and analyze the global footprint of fishing. These data can further the understanding of global fisheries. Check it out.
Public availability of these data will allow anyone to answer questions about the global fishing fleets. Possibilities include: assessments of which species are at risk to overfishing; spatial planning of future MPAs; analysis of how fishing responds to different regulations; how fishing responds to climate change and other environmental drivers; how different fleets are affected by subsidies; and many others—interview our research partners to learn more.
For more information, visit our media center.
Twitter: @GlobalFishWatch
Facebook: @GlobalFishingWatch