Ports are critical hubs in global supply chains and provide vessels of all types with access to support services like fuel and supplies. Unscrupulous actors may seek to avoid scrutiny and operate out of ports with little or reduced oversight. Effective monitoring of fishing ports is important to combating illegal, unreported, and unregulated (IUU) fishing and eliminating labor abuses on board fishing vessels. Vessel tracking data provide insights into the movements of individual vessels, allowing us to understand their movement patterns around the globe. These data can show us where vessels congregate and help identify the locations of anchorages and ports. By monitoring when and how often vessels visit this network of ports, together with our transshipment dataset, we are able to provide unprecedented insight into maritime supply chains and better understand risks associated with a range of issues from IUU fishing or forced labor to invasive species.

How it works
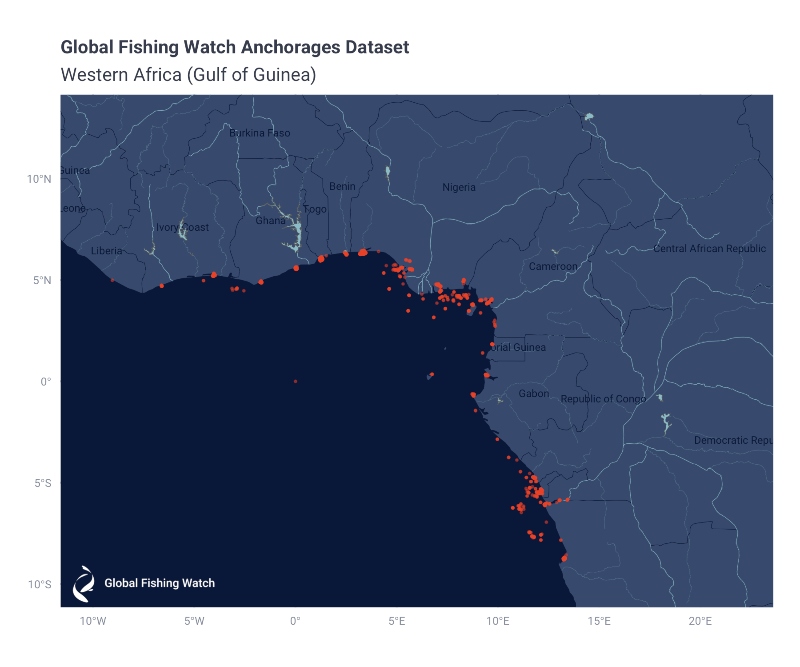
Using cloud computing, we track over 400,000 vessels to build a dataset of more than 160,000 anchorage locations associated with nearly 32,000 ports.
Identifying anchorages
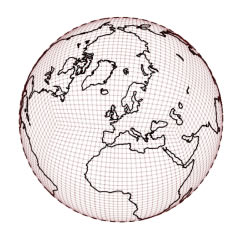
To identify anchorage points, we start by dividing the globe into cells using a grid. Without special care, such a grid would have cells located at the poles that encompass different areas than cells at the equator. However, using a type of grid made up of what are called s2 cells, we can produce a gridded overlay in which all grid cells have roughly the same area. The area of each s2 cell is specified by a level, from 0 (grid cells that are 9,220 kilometers on a side) to 30 (grid cells 1 centimeter on a side). We use a s2 level of 14, resulting in grid cells roughly 0.5 kilometer on a side. Each s2 cell in the grid has a unique identifier, s2id, which corresponds to the spatial location of that cell.

Across this grid, we identify where individual vessels remain stationary according to automatic identification system, or AIS, data, which we define as when a vessel moves less than half a kilometer over at least a 12-hour period. If, within an s2 cell, at least 20 unique vessels remained stationary at some point since 2012, we identify this cell as an anchorage point.
The anchorages data set is continuously extended by incorporating anchorage locations contributed by Global Fishing Watch users, as well as regional or country-specific anchorages databases. All contributed anchorages and their locations take precedence over locations derived from AIS within a given s2 cell. In some cases, when many anchorages are adjacent, such as in large ports, it is useful to group anchorages together. We implement a simple grouping scheme by combining anchorage points located within 4 kilometers of one another into groups, which are generated using specific methods and code in BigQuery and Python.
Anchorage naming
We seek to name each anchorage point, or s2id, by referencing publicly available datasets and provisionally applying names to each anchorage. Often, a single port is made up of a number of different anchorages. We assign names to anchorages, grouping them into ports using a multistep process and several primary data sources:
- The World Port Index, which can be found on GitHub.
- The GeoNames 1000 database. Current data on GitHub.
- The top destination as reported in the AIS messages of the stationary vessels that defined the anchorage.
- User contributed names and regional port databases.
To name each anchorage we first apply any names from the manually reviewed and user-contributed list of anchorage names, which is available on GitHub. For any unnamed anchorages, we identify those anchorage points that are within 4 kilometers of a World Port Index port and assign the unnamed anchorage point that specific port name. Next, if an anchorage is provided by a curated regional list and corresponds to an anchorage in our database—occurs within the same s2 cell—we assign the curated anchorage name to the anchorage in our database. For the remaining unnamed anchorages, we identify those that are within 4 kilometers of a GeoNames 1000 city from the GeoNames database, and assign the anchorage point the GeoName 1000 city name. For those anchorage points that remained unnamed, we assign the top AIS destination name. The same anchorage groups as described for the unnamed anchorages have been included.
Port visits and vessel voyages
Once we know where anchorages are located, we can track when vessels visit each port and also monitor their activity during individual voyages. With hundreds of thousands of anchorage locations, vessels may come near anchorages very often and the challenge is determining when a vessel makes an actual port visit. To ascertain this, we use several proximity and speed thresholds to identify when a vessel enters and exits a port and track several types of events related to its behavior while in port.

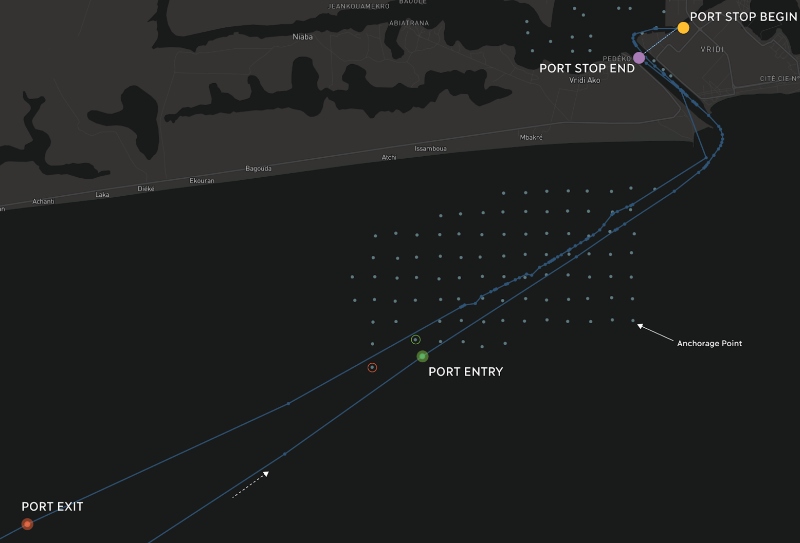
A vessel enters port when it comes within 3 kilometers of an anchorage point and exits port when it is outside 4 kilometers of the anchorage point. We use different threshold distances to avoid situations where a vessel continuously enters and exits port. This situation is still common, however, as vessels travel along coastlines and repeatedly come within close proximity to numerous anchorages. To distinguish actual port visits from coastal transits, we further identify when a vessel appears to stop at a given port.

The vessel is considered to have “stopped” at port if its speed drops below 0.2 knots, and this port stop ends when the speed rises above 0.5 knots. AIS is often switched off when a vessel enters port, and it is turned back on when it leaves. As a result, we track port “gaps,” where a vessel that has entered port does not broadcast on AIS for at least four hours.
Port stops and port gaps are behaviors indicating that a vessel visited a port for a specific reason and/or engaged in some activity while at the port, such as landing catch or exchanging supplies and crew. We can then allocate the at-sea activity of vessels to individual voyages between port visits.
Access the data
The anchorages and port visits datasets can be explored on our carrier vessel portal. The complete anchorages dataset is available via our data download portal.