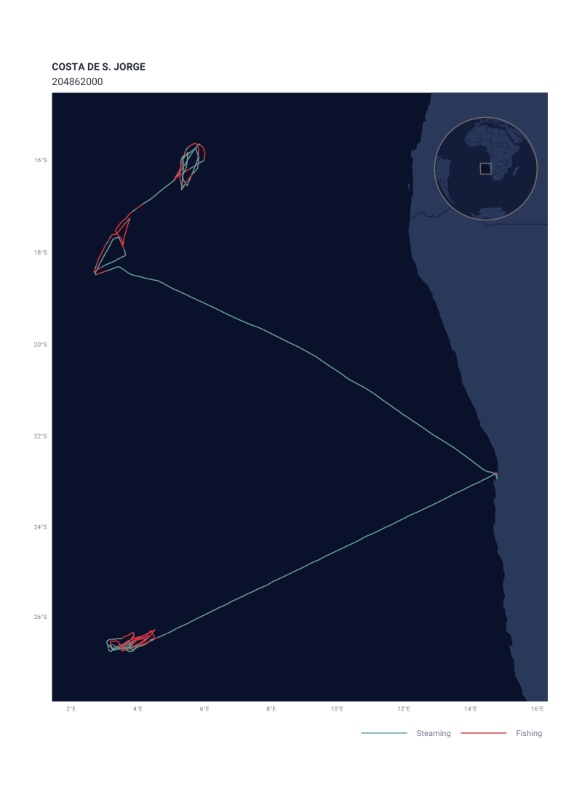
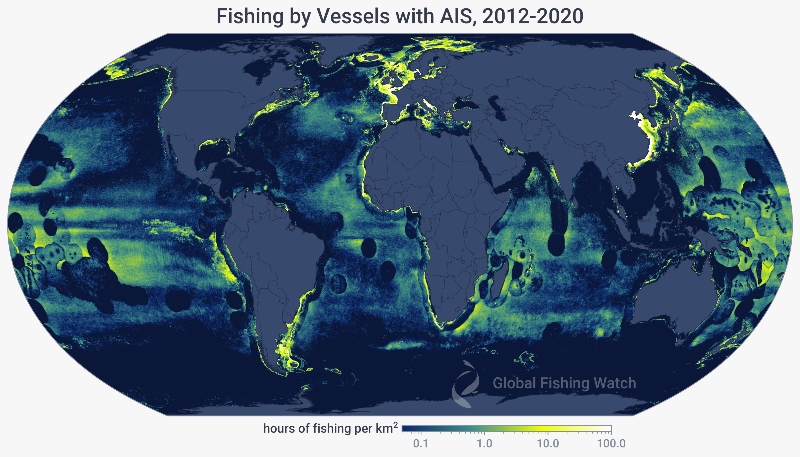
Global Fishing Watch’s flagship dataset is apparent fishing effort based on transmissions broadcast using the automatic identification system (AIS, a vessel tracking system originally designed for collision avoidance). In 2018, we published the first global assessment of commercial fishing activity in Science. Our research found that fishing is both widespread—occurring throughout approximately 50 percent of the ocean—and highly concentrated, with more than half of fishing activity occurring in just 0.5 percent of the ocean. Fishing is also minimally affected by seasons but strongly affected by culture; the biggest drops occur during weekends, holidays, and the annual Chinese summer moratorium.
Today we receive over 60 million AIS messages each day and continually update our technology and algorithms to improve our ability to monitor global commercial fishing. This entire dataset can be explored on our map, dating all the way back to 2012, or downloaded from our data download portal.
How it works
Using cloud computing, machine learning and public vessel registry information, we analyze tens of millions of AIS positions each day to map global apparent fishing effort. Producing such a map involves two key steps:
- Identification of fishing vessels in the AIS data
- Detection of fishing activity
Processing AIS data
AIS is a GPS-like device that large ships use to broadcast their position in order to avoid collisions. Each year, more than 400,000 AIS devices broadcast vessel location along with other information on vessel identity, course and speed. Ground stations and satellites pick up this information, meaning a ship’s movements can be followed even in the most remote parts of the ocean.
Every day we receive raw AIS data from our partners at ORBCOMM and Spire. These data are first run through a series of our algorithms designed to filter out corrupt or incomplete records and assign additional information to each AIS message, such as the distance from shore, depth and time since the vessel’s previous AIS position. At this point, the AIS data is ready to be used by our machine learning models.
Detecting apparent fishing activity
We use two convolutional neural networks (CNN)—a cutting edge form of machine learning model—to help us classify fishing vessels and predict when they are fishing. We refer to these models as our “vessel characterization” and “fishing detection” models, respectively. The details of both CNN models are described in detail in the supplementary materials of our 2018 Science paper.
Before we can map fishing activity, we must first identify fishing vessels in the AIS data. We accomplish this by combining our comprehensive database of vessel registry information with the output of our vessel characterization model— predicting features like geartype and size—and use the best available information for each vessel. Next, we estimate where and when each vessel is fishing based on its movement patterns.
We manually labeled over a thousand vessel tracks to train our fishing detection model to learn what fishing movements look like. This model predicts a score for every AIS position in our database to distinguish fishing positions from non-fishing positions, such as during vessel transits. When our fishing detection model scores an AIS position as a fishing position, the time associated with that AIS position is considered apparent fishing activity.

Summarizing apparent fishing effort
After identifying fishing vessels and detecting fishing positions in the AIS data, apparent fishing effort can be calculated for any area by summarizing the fishing hours for all fishing vessels in that area. To generate maps of apparent fishing effort we then “rasterize” the AIS positions by placing them into a grid and calculating the total fishing activity in each grid cell.

Using vessel identity information, such as vessel class and flag State, allows us to describe fishing activity by specific groups of vessels. Because fishing activity is assigned to individual AIS points, we can make these rasters of AIS-based apparent fishing activity at any spatial and temporal resolution.
Caveats and limitations
While AIS provides a revolutionary way to monitor global commercial fishing activity, there are several important limitations and caveats. First, AIS data includes only a small fraction—approximately 70,000—of the world’s estimated 2.8 million fishing vessels. Coverage is much higher for larger vessels with less than 1 percent of vessels under 12 meters represented, 14-19 percent for vessels between 12-24 meters, and 52-85 percent for vessels larger than 24 meters. The International Maritime Organization mandates AIS for most vessels larger than 36 meters, and vessels broadcasting AIS are predominantly from upper and upper-middle income countries.
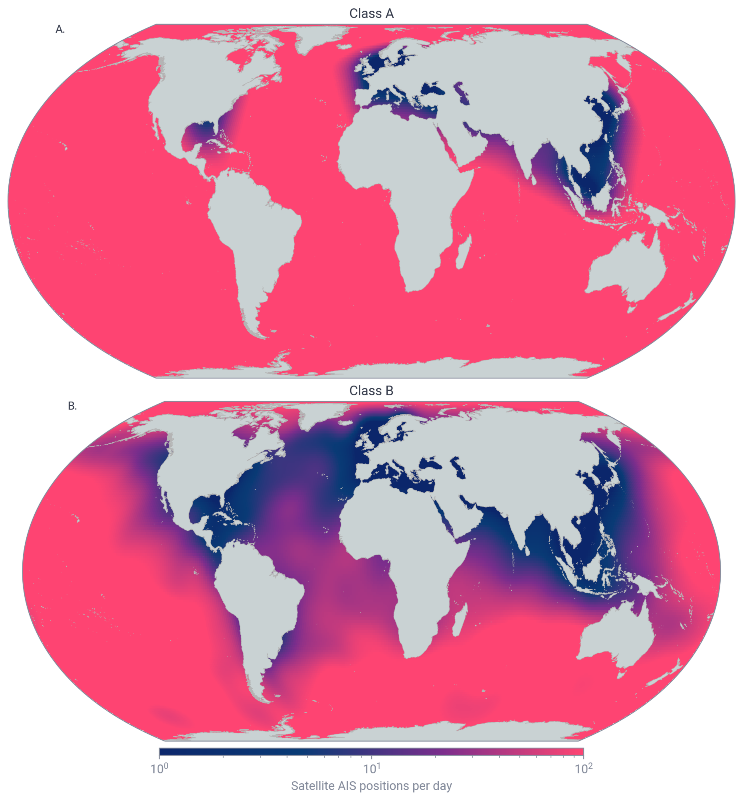
Another key caveat is that not every AIS message that is broadcast is recorded. Satellites must be overhead to receive AIS signals, terrestrial receivers only receive signals near shore, AIS messages can interfere with each other in areas of high vessel density, and AIS devices vary in broadcast strength and frequency. As a result, fewer AIS positions are received by vessels operating in certain parts of the world, limiting the effectiveness of our machine learning models and our ability to detect apparent fishing effort.

Finally, as more vessels have adopted AIS and more receivers, both satellite and terrestrial, have started recording AIS messages, the amount of activity in the AIS dataset has increased. This rise in activity in the early years of the AIS dataset (2012-2016) should not simply be interpreted as an increase in fishing activity, though that may have happened in some areas.
Access the data
Anyone with an internet connection can trace the movements of about 70,000 commercial fishing boats, along with their name and flag State, in near real-time on our map. Users can create heat maps to see patterns of commercial fishing activity, view tracks of individual vessels, and overlay information like the locations of marine protected areas or different countries’ exclusive economic zones .
Our AIS-based apparent fishing effort data can be downloaded via our data download portal. Fishing activity is summarized by day and rasterized in two formats:
- By flag State and vessel class at 100th degree resolution
- By MMSI number at 10th degree resolution.
These datasets are also available on Google’s BigQuery platform from the following two publicly available tables:
- global-fishing-watch.gfw_public_data.fishing_effort_v2
- global-fishing-watch.gfw_public_data.fishing_effort_byvessel_v2