In the 23 February 2018 issue of Science, along with research partners at University of California Santa Barbara, National Geographic Pristine Seas, SkyTruth, Dalhousie University, Stanford University, and Google, we published a global analysis of fishing effort using AIS data. We have made our data on the vessel identity and fishing effort freely available. This post provide links to materials associated with this paper, including how to download and used the data we released with the paper.
Data & Code Access
Blog Posts About Using and Interpreting Data
Other Resources and Blog Posts
- View an interactive graphic showing fishing by flag state
- Over Half the Ocean is Fished
- Access our press release and media kit (Press release in English, Spanish, French, and associated fact sheet)
About the Paper and Dataset
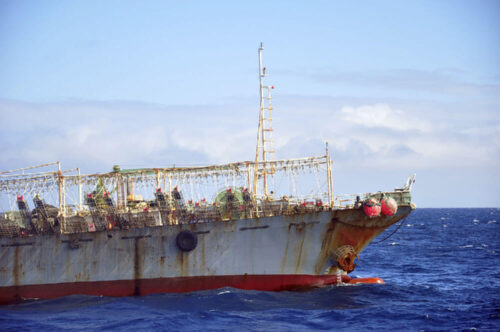
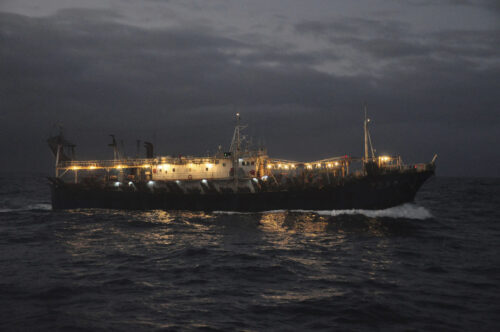
Humans have been fishing the seas for over 42,000 years and fishing is one of the most widespread means by which humans harvest natural resources. However, fishing’s global footprint – that is, its spatial and temporal patterns, and extent – was poorly understood and unquantified, until now. “Tracking the Global Footprint in Fisheries,” a new paper published in Science, presents a comprehensive, high-resolution map of global fisheries for the first time.
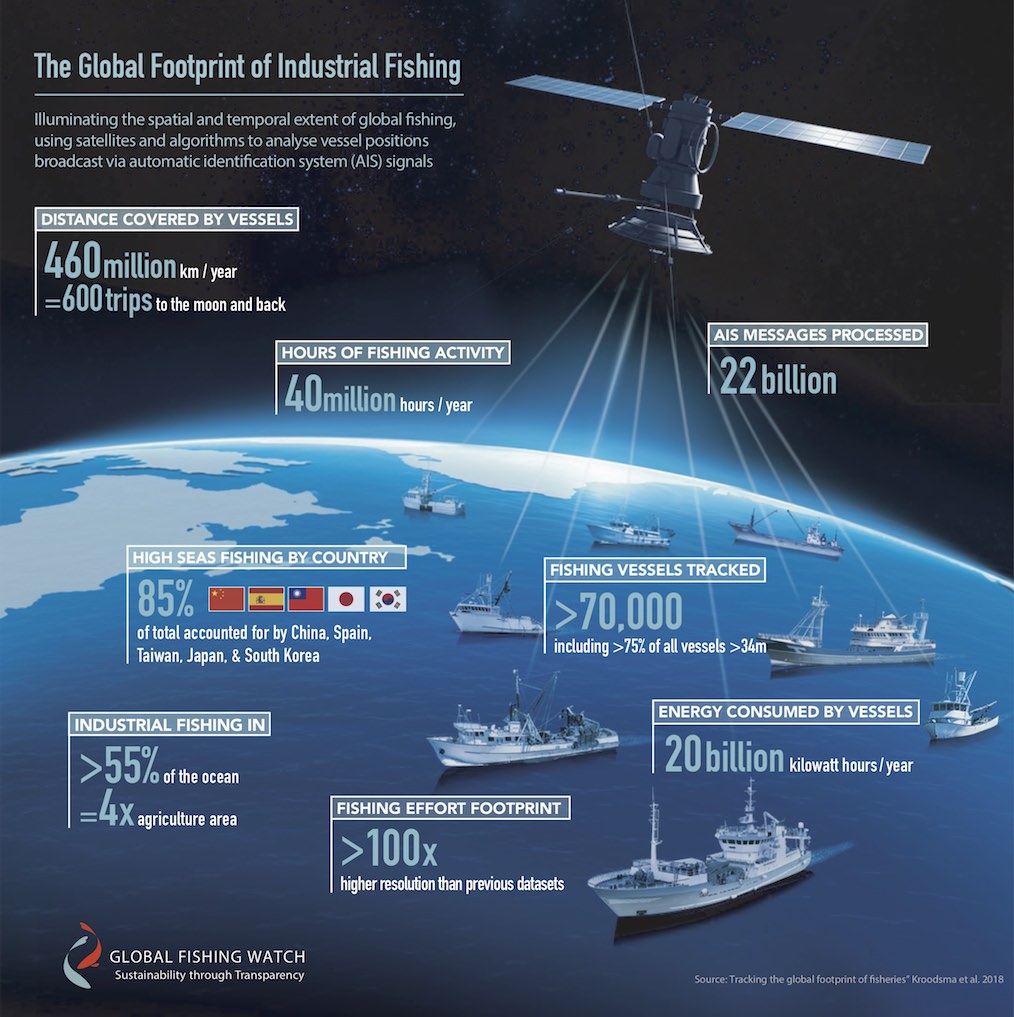
This new dataset is possible because of new technology and creative use of data sources. Over 22 billion Automated Identification System (AIS) messages were processed and the researchers identified more than 70,000 seagoing vessels – including >75 percent of industrial fishing vessels larger than 36m – over a five-year period (2012 to 2016). Over the span of the study, these vessels engaged in 40 million hours of fishing activity, consumed 20 billion kilowatt hours of energy, and covered a combined track length of 460 million km, a distance equal to traveling to the moon and back 600 times.
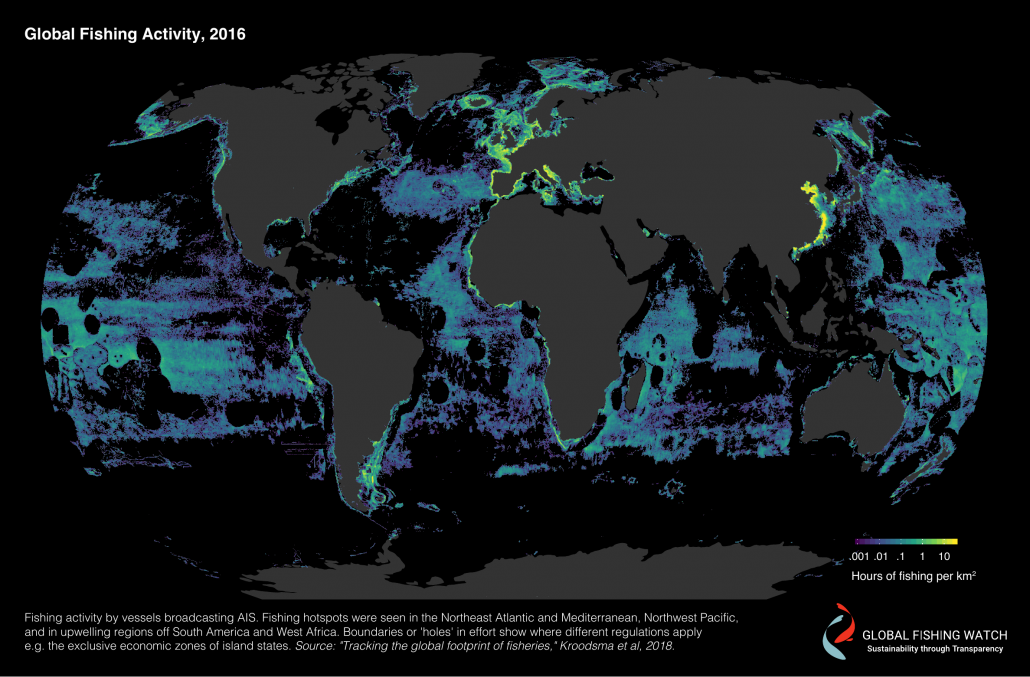
Results revealed that fishing extends over at least 55 percent of the ocean – covering almost four times more of the Earth’s surface than agriculture. The absolute footprint of fishing is much larger than that of other forms of food production, even though capture fisheries provide only 1.2 percent of global caloric production for human food consumption. Five flag states – China, Spain, Chinese Taipei, Japan and South Korea – accounted for over 85 percent of observed fishing effort on the high seas.
Surprisingly, results also suggested that fishing activity is more closely tied to cultural and political events, like holidays and fishing regulations, than naturally-occurring events, like El Niño or fish migrations. In China, there is a significant decline in fishing during the annual fishing moratorium and the Chinese New Year. In the northern hemisphere, fishing activity declines over the weekend and breaks for Christmas.
Longline fishing in the open ocean for species such as tuna, shark and billfish, was the most widespread type of fishing globally, detected in 45 percent of the ocean. Longliners also had the greatest average trip length between anchorage, with the longest at 7,100 km.
Results also demonstrated that significant regions of the ocean are not heavily fished, and these areas may offer opportunities for low-cost marine conservation, creating ‘buffer zones’ which conservationists say help marine species to regenerate.
The data used to create this report and power the Global Fishing Watch fishing activity map is now available for download via the Global Fishing Watch Research Accelerator Program. The researchers hope that this data provides the tools for scientists, advocates, governments, journalists and citizens to better understand and therefore better protect their oceans. The data is also available through Google Earth Engine.