Ask the Expert
Tim Hochberg
Senior machine learning engineer

How do you match automatic identification system data with satellite imagery to identify publicly tracked vessels?
Automatic identification systems, commonly referred to as AIS, transmit a ship’s position and alerts others to its whereabouts. While originally designed as a collision avoidance mechanism, AIS is regularly used in the monitoring and oversight of fishing fleets. But there are limitations to AIS.
Aside from AIS not being universally mandated, poor reception can mean incomplete positional information and the manipulation of the data itself allows operators to conceal their actual locations—AIS can even be switched off completely. To build a comprehensive picture of what is taking place at sea, AIS is often matched against other types of data, including satellite imagery. This allows us to determine if what we are seeing is consistent with what the tracking data is showing us.
But matching AIS data with satellite imagery is challenging. This is because AIS messages are received at irregular intervals—far less often than they are transmitted. A vessel may broadcast an AIS message once every three minutes—sometimes even several times per minute depending on what type of AIS transponder is being used and what the vessel is doing—but these messages are not always received. This is a result of many factors, which includes intermittent satellite coverage, poor reception due to high concentrations of vessels overloading receivers and the discretionary reduction of messages to save data by the AIS providers. As a result, we often have to estimate a vessel’s position at the time the image was taken based on messages that were sent minutes or even hours before or after. To make matters more complex, satellite images often contain multiple vessels, some of which aren’t equipped with AIS, making it difficult to match the data. And sometimes vessels don’t appear in the imagery at all–a particular problem for small boats.
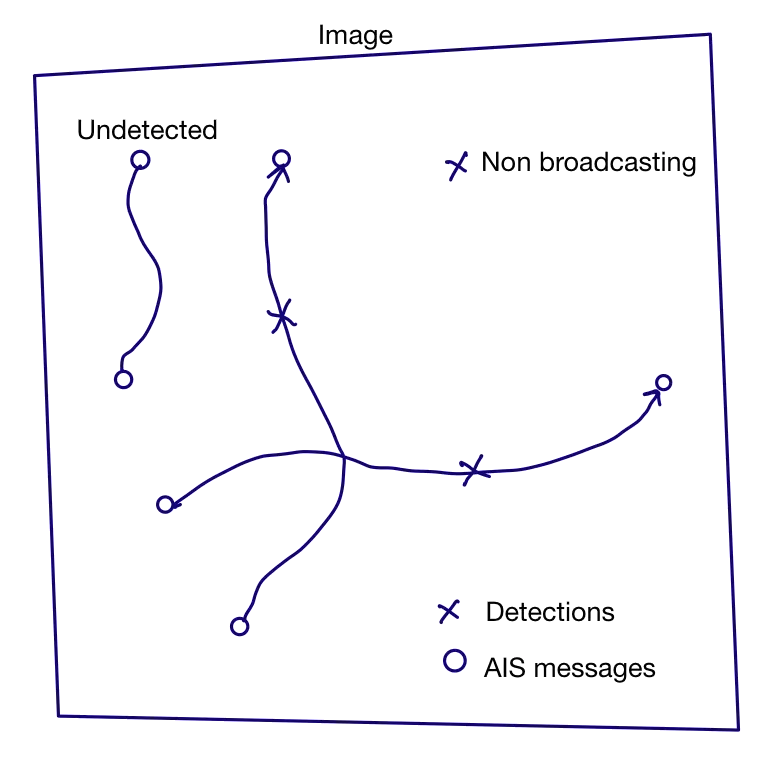
Situations that may arise during AIS matching
When one or more detected vessels are transmitting AIS messages (center two tracks) we need to identify which message corresponds to each vessel. This can be complicated by the need to take into account that vessels may be detected that are not broadcasting AIS (upper right track) and some broadcasting vessels may not be detected in the image (upper left track). ⓒ 2023 Global Fishing Watch
The key to accurately matching AIS data to satellite detections is estimating how likely each vessel is to be at each detection given the messages transmitted just before and after the image was taken. There are many ways to approximate this, with each approach based on different assumptions about how vessels move. We have found the most effective approach is to mine the historical AIS data to compute the probabilities. That is, considering a vessel’s type and speed, we can compute the probability that the vessel is in any particular place relative to its starting position and heading.
For example, in the figure below, we show the probability maps for cargo vessels and longliners after 16 minutes at various speeds—3, 5, 7 and 9 knots. If the ship continued straight at constant speed, we would find it at the center of the map. The probability peaks there, which is indicated by the brightest section of each image. It is typically assumed that the probability falls off symmetrically from that point, which would result in circular probability maps. However, in practice these maps can be very asymmetric, shifting from fairly circular at low speeds to more thumbtack-shaped at higher speed. And details of the map vary between different types of vessels.
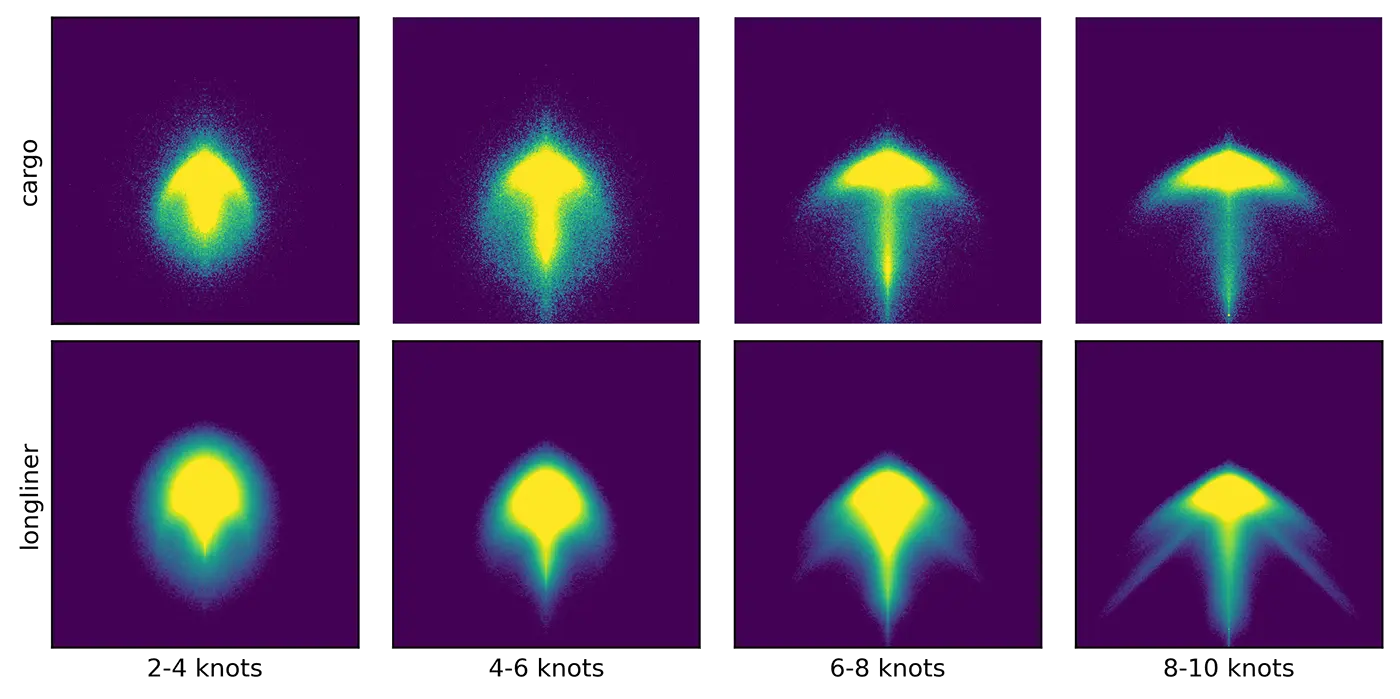
Probability maps for two vessel types at various speeds
ⓒ 2023 Global Fishing Watch
Computing and efficiently storing these probability maps is a core challenge associated with this matching method. Before we begin matching, we look up the probability map corresponding to the vessel type, speed and time relative to when the image was taken for each AIS message. If there is a corresponding message for a vessel both before and after the image was captured, we merge the two resulting maps and use a weighted average so that we have one probability map for each vessel.
Once we have probability maps for every set of AIS messages in a given scene, matching is pretty straightforward. First, we match the detection-message pair with the highest probability and then remove that pair from consideration. We then repeat this with detection-message pairs until we have matched all the pairs or the probability drops below our threshold, meaning that a match is unlikely enough that we risk making false matches involving non-broadcasting and non-detected vessels.