Ask the Expert
Fernando Paolo
Senior remote sensing machine learning engineer

How is satellite data used to map human activity at sea?
Analyzing large data streams of satellite synthetic aperture radar (SAR) and optical imagery–a core component of the work we do at Global Fishing Watch–requires a complex workflow. A constellation of satellites image the ocean daily, adding new data to dedicated archives with petabytes of imagery that we process for global-scale analysis. Our team relies on a range of experts for this work that include remote sensing researchers, artificial intelligence (AI) developers, data scientists and cloud engineers to process this data. On the technical side, we use advanced computing to perform big data queries and to train AI models on multiple high-performance GPUs, or graphic processing units. This infrastructure allows us to map human activity at sea on a scale that’s never been done before.
Our workflow starts at an image processing stage, where we pull large streams of minimally processed SAR and optical (both visible and infrared) imagery from multiple sources, including NASA, the European Space Agency, MDA and Google. To create image tiles suitable for geospatial analysis, we need to: calibrate and correct radar artifacts and reproject SAR images; filter cloudy optical images; scale pixel values and crop the scenes. But the work doesn’t stop there.
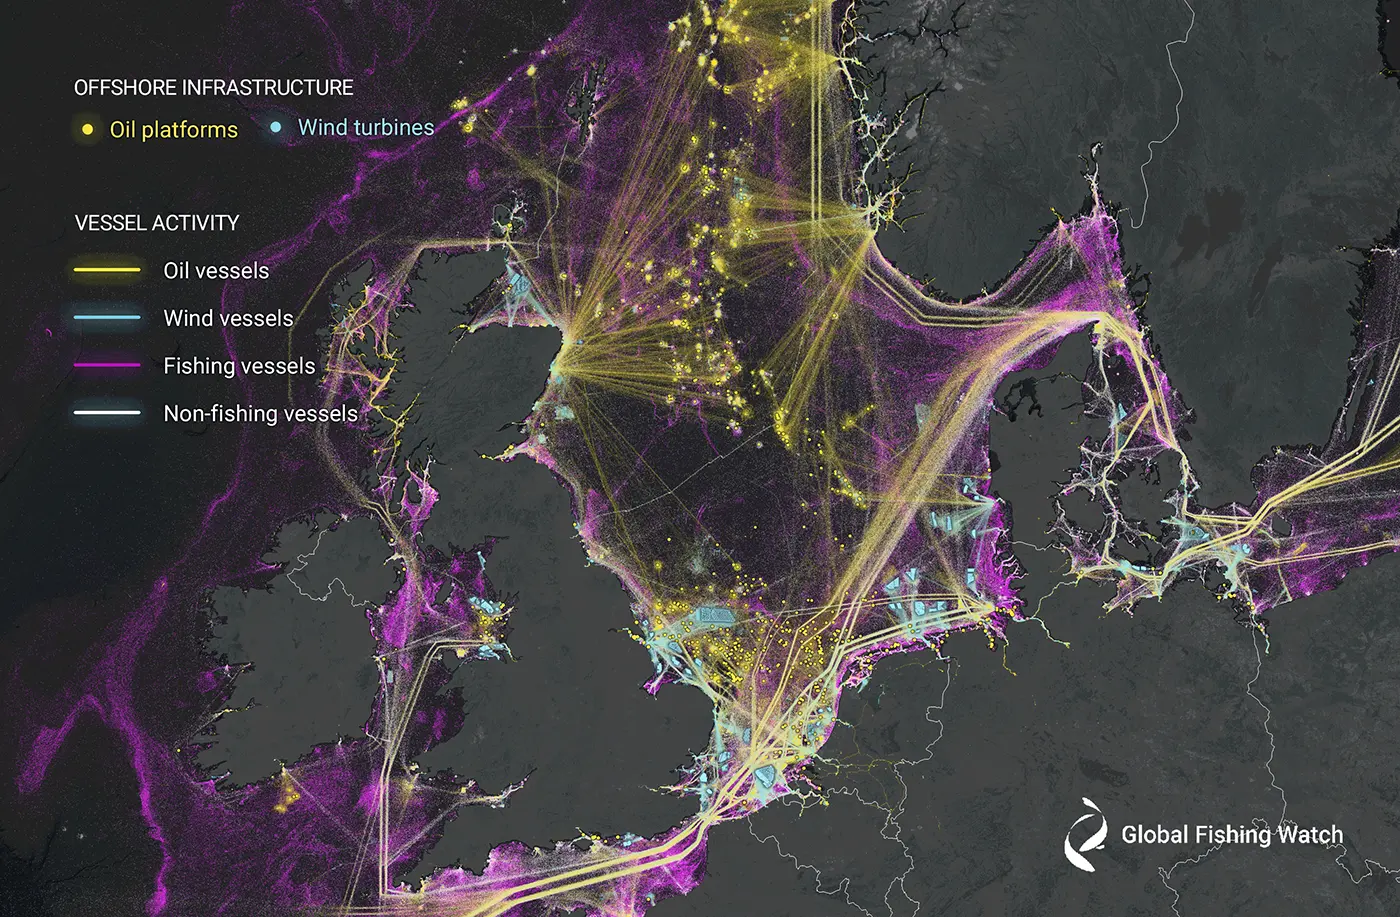
Global Fishing Watch uses AI and satellite imagery to map vessel traffic and offshore infrastructure to provide an unprecedented view of previously unmapped industrial use of the ocean, as seen here in the North Sea. ⓒ 2023 Global Fishing Watch
Next comes a detection stage, where maritime objects like vessels and offshore infrastructure are automatically detected in each image. We currently have two approaches for small object detection: the first is statistics-based—a form of adaptive algorithm called a constant false alarm rate; the other is AI-based—a deep neural network. Basically, each image is scanned to determine the location of maritime objects. In AI-based detections, information on vessel length, and sometimes course and speed, is also obtained.
A classification stage follows. For statistics-based detections, we use AI models to identify false detections that help filter out other objects that are present, like rocks or ice. This same model also estimates the length of the object. We then classify whether a fixed structure is an oil platform, wind turbine or some other human-made structure. Another model is used to identify whether a detected ship is either a fishing or non-fishing vessel. This classification is based on the vessel length and information about the surrounding environment, including vessel traffic and distance from port. It also considers the depth of the water and surrounding sea conditions, such as temperature, currents and the amount of chlorophyll present.
At the final matching stage, we analyze billions of GPS vessel coordinates broadcast by vessels across the ocean through the automatic identification system (AIS) or vessel monitoring system (VMS). We then correlate millions of satellite detections, including time, vessel position and length, with existing AIS and VMS data to determine whether a vessel was transmitting its position or simply did not exist in public monitoring systems. Once we’ve completed the matching process, we crosscheck the results with domain experts to assess the accuracy of our final data set.