Partnering with Planet to bring coastal waters and small vessels into focus
By
David Kroodsma
Published
High-resolution optical imagery expands views and leads to significant advances in vessel detections
We set out on an audacious goal at Global Fishing Watch two years ago: to map all human activity at sea. We are making incredible strides toward this goal thanks to our partnership with Planet, which enables us to draw on timely, high-resolution satellite imagery.
We have already used satellite imagery to map human activity at scale, processing more than two petabytes of imagery from the European Space Agency’s Sentinel-1 and Sentinel-2 satellites. However, while their imagery has allowed impressive breakthroughs, it only allows us to see larger vessels. The vast majority of fishing vessels–more than two million–are under 12 meters in length, fish predominantly close to shore and do not broadcast their GPS coordinates. Those vessels dominate the world’s coastal waters, but are too small to be detected in the free imagery we have processed from the Sentinel constellations.
In Southeast Asia, Capacity Building Efforts Bolster Marine Protection
Posted on
Insights
Ask Global Fishing Watch: Preferential access areas
Posted on
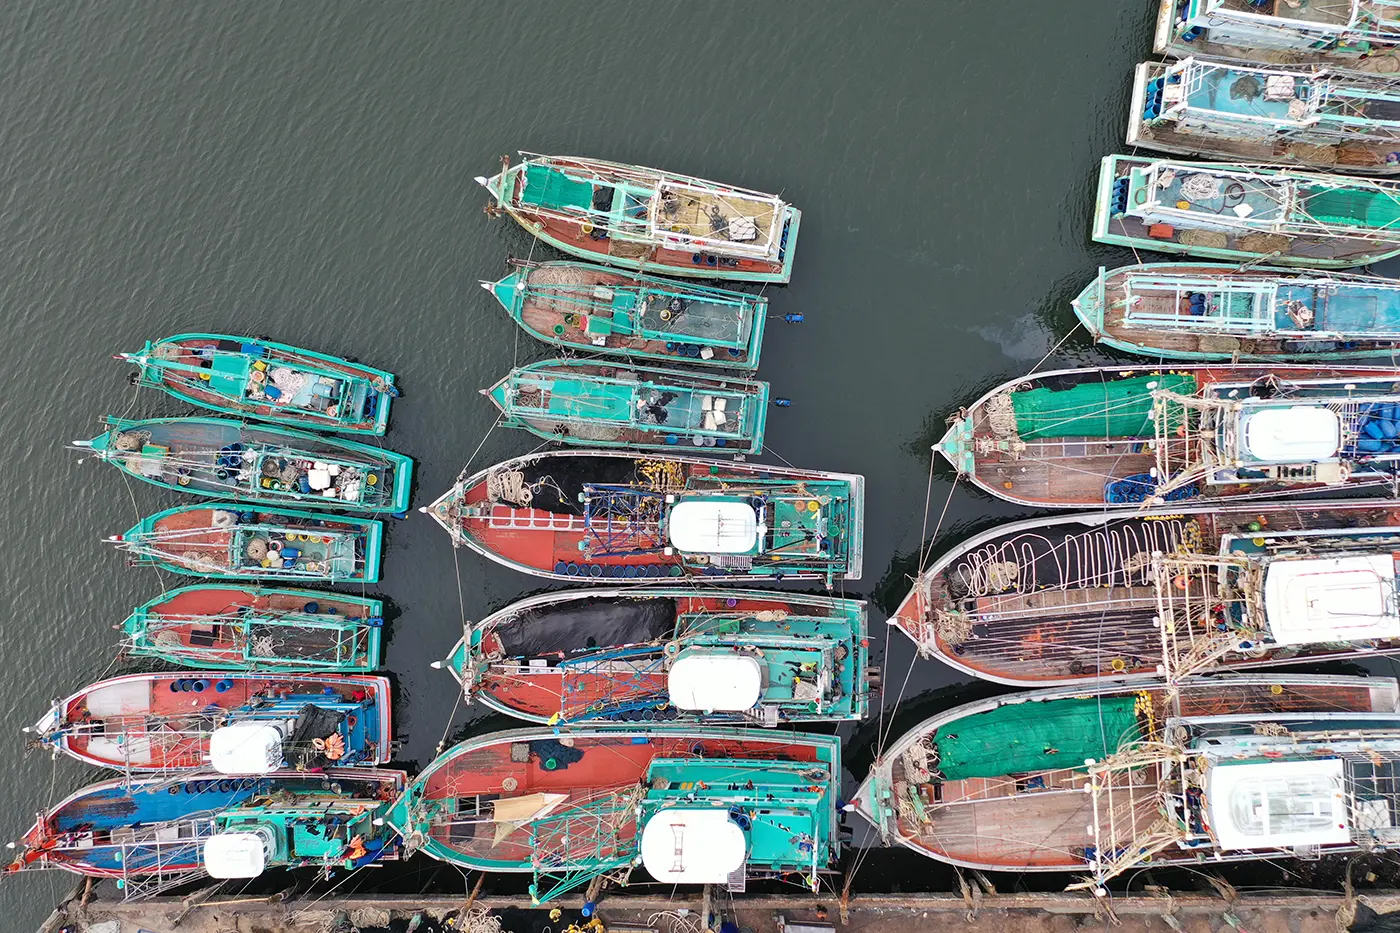
The majority of fishing vessels are under 12 meters in length and operate in areas close to shore.
But that is changing. We are bringing small vessels into view by drawing on huge amounts of higher resolution imagery from Planet, processing two million square kilometers of imagery from their satellites per day. And while we are still refining the technology and vessel detections, we are already seeing incredible results. These results will inform better enforcement of marine protected areas, produce detailed global maps of trawling activity, enable new maps of global aquaculture and even help us estimate the carbon footprint of humanity at sea.
Here’s how.
Studying global coastal waters
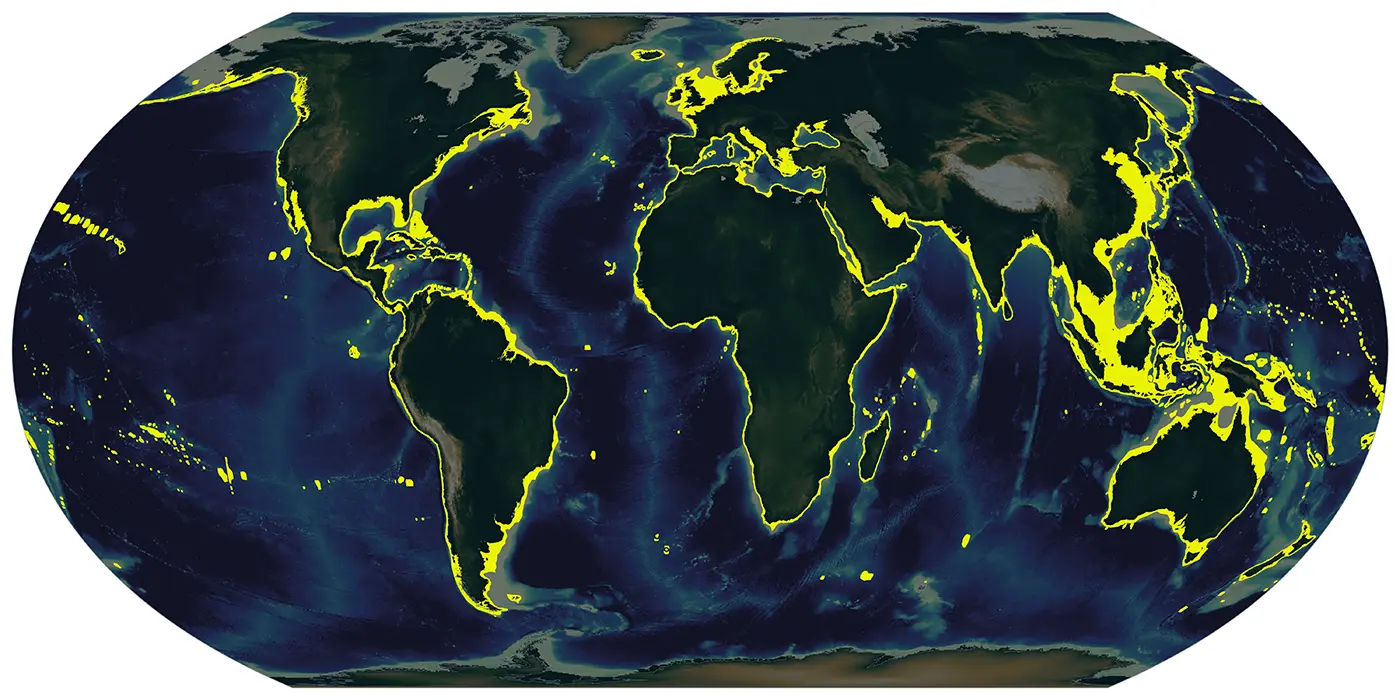
Planet is an industry-leader in capturing ocean data, with over 20 million square kilometers of ocean imagery collected daily – including nearly all coastal waters at 3-meter resolution. This is essential to monitoring smaller vessels that spend almost all of their time close to shore. In fact, we estimate that vessels under 12 meters spend almost all of their fishing effort in the first 20 kilometers from shore, an area that accounts for less than 5 percent of the ocean.
Sentinel-2 data has allowed us to see where vessels have been active, so we have used its lower 10-meter resolution imagery to decide where to “zoom in” and then obtain higher resolution images from Planet. The area we have selected looks like a halo around the continents, extending far from shore only in shallow areas that see heavy fishing along the continental shelves.
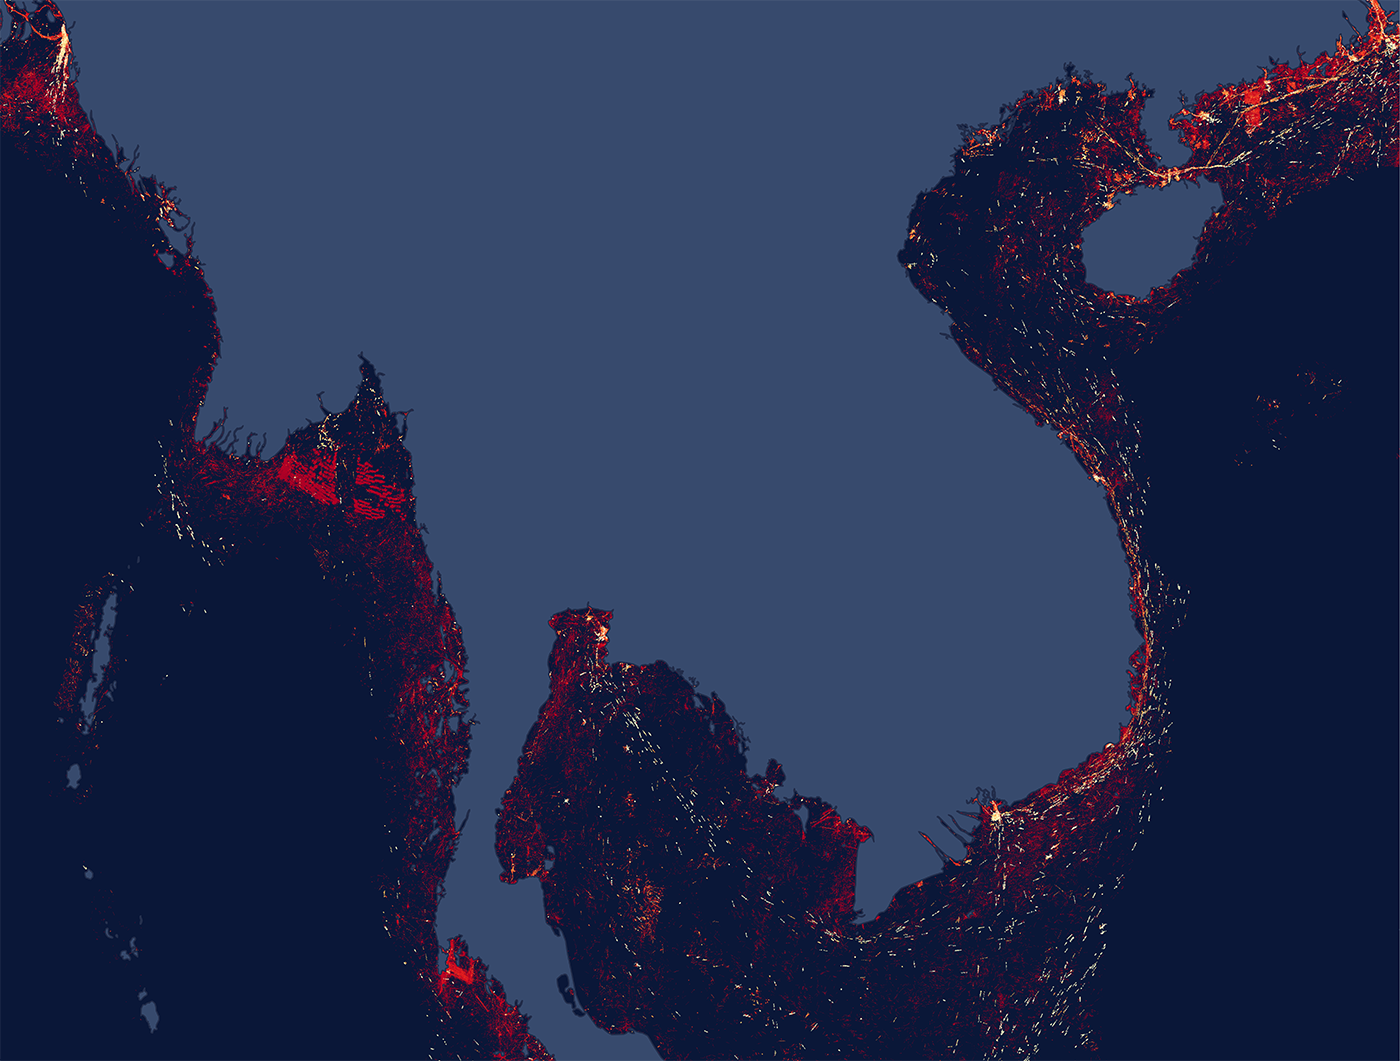
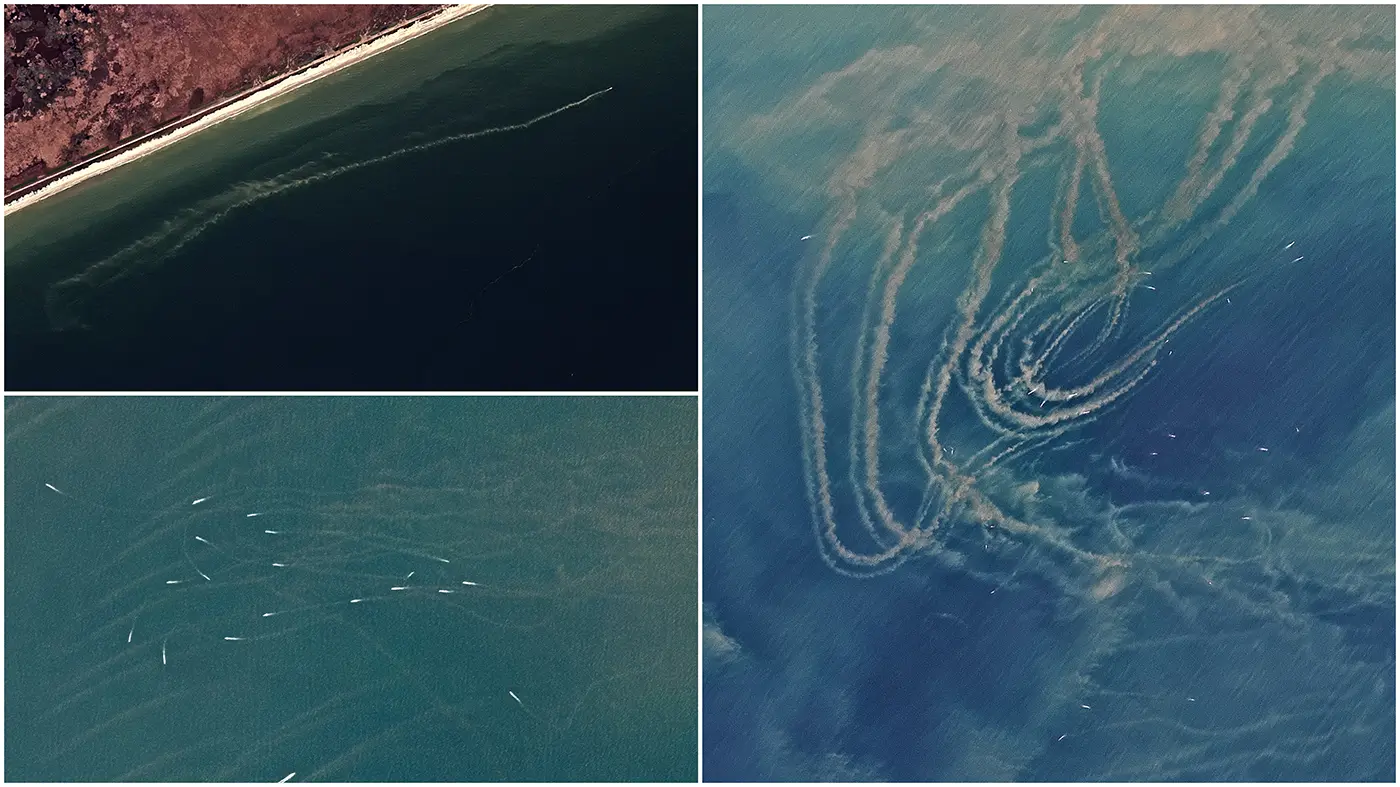
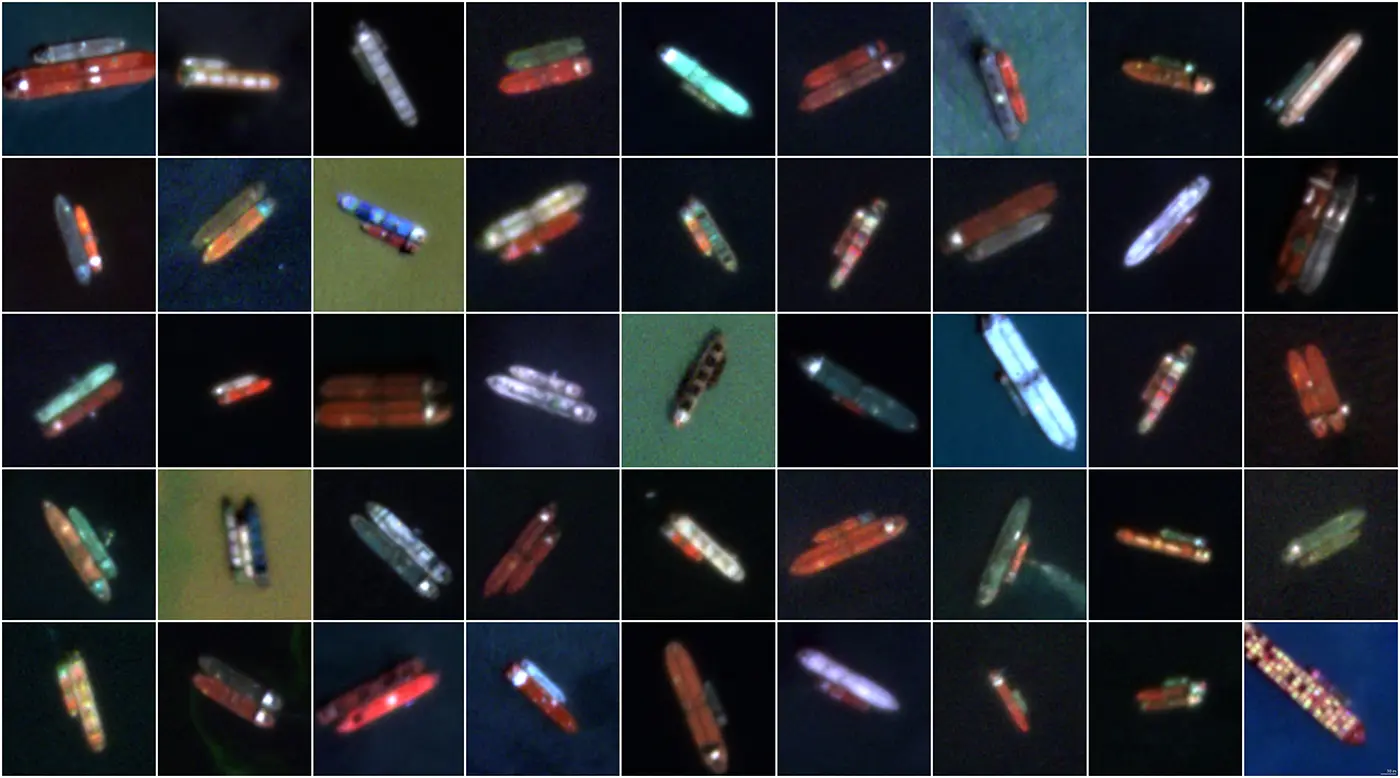
By combining detections over time, we can make maps that show the average activity of vessels throughout a region. We can also detect the size of vessels in imagery, their orientation and each vessel’s speed, based on its wake pattern.
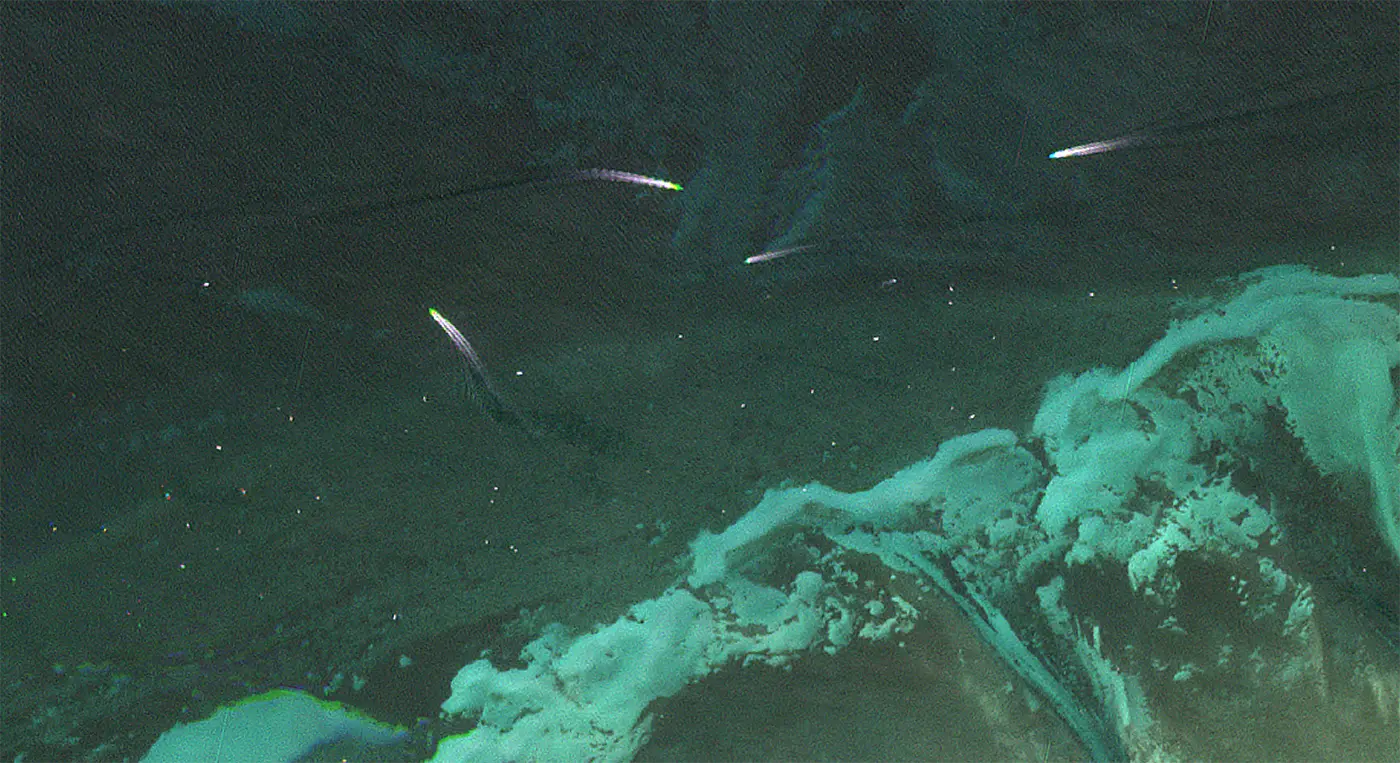
Our research suggests we can detect vessels as small as 5 meters in length, or even less if the boats are moving. This is a huge advance from what is possible with Sentinel-2 imagery, as can be seen in this image from Planet of a two day lobster season in the Florida Keys. Moving boats are clearly visible with their wakes, but each of the small white dots are also vessels. All of those boats–more than 40 in this image–are too small to detect through our other imagery sources. Relying solely on using Sentinel-2 imagery, we would have undercounted the number of vessels by about a factor of 10.
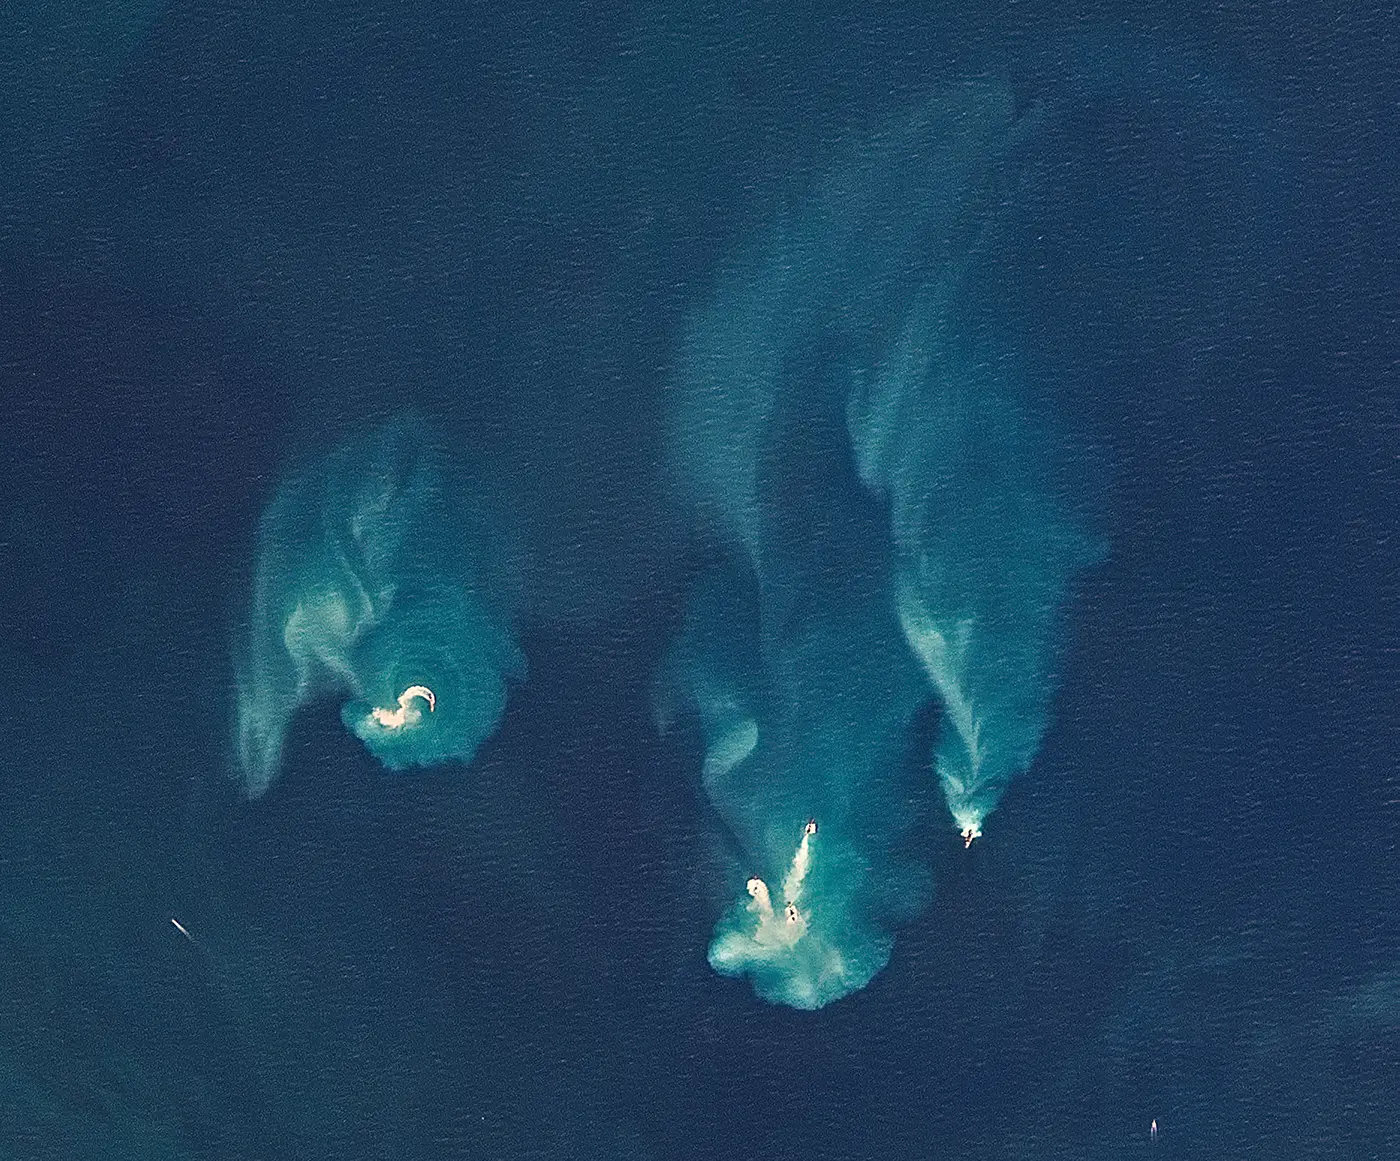
We can also detect specific types of fishing using Planet’s imagery. One of the most destructive and controversial forms of fishing is bottom trawling, which drags a net along the seabed, damaging benthic ecosystems and resulting in very high rates of bycatch. Trawlers often kick up lots of sediment in their wake as they fish – large plumes we can map from space that can disrupt marine biodiversity and contribute to the climate crisis.
Fishing may be the most widespread activity in the ocean, but it is not the only one. In addition to seeing where trawlers disturb the seabed, we can see where sand dredgers are impacting marine ecosystems. These dredgers may be clearing channels for vessel traffic, or harvesting sand for construction. Sand mining is itself highly destructive and better maps of where this activity takes place could guide better management.
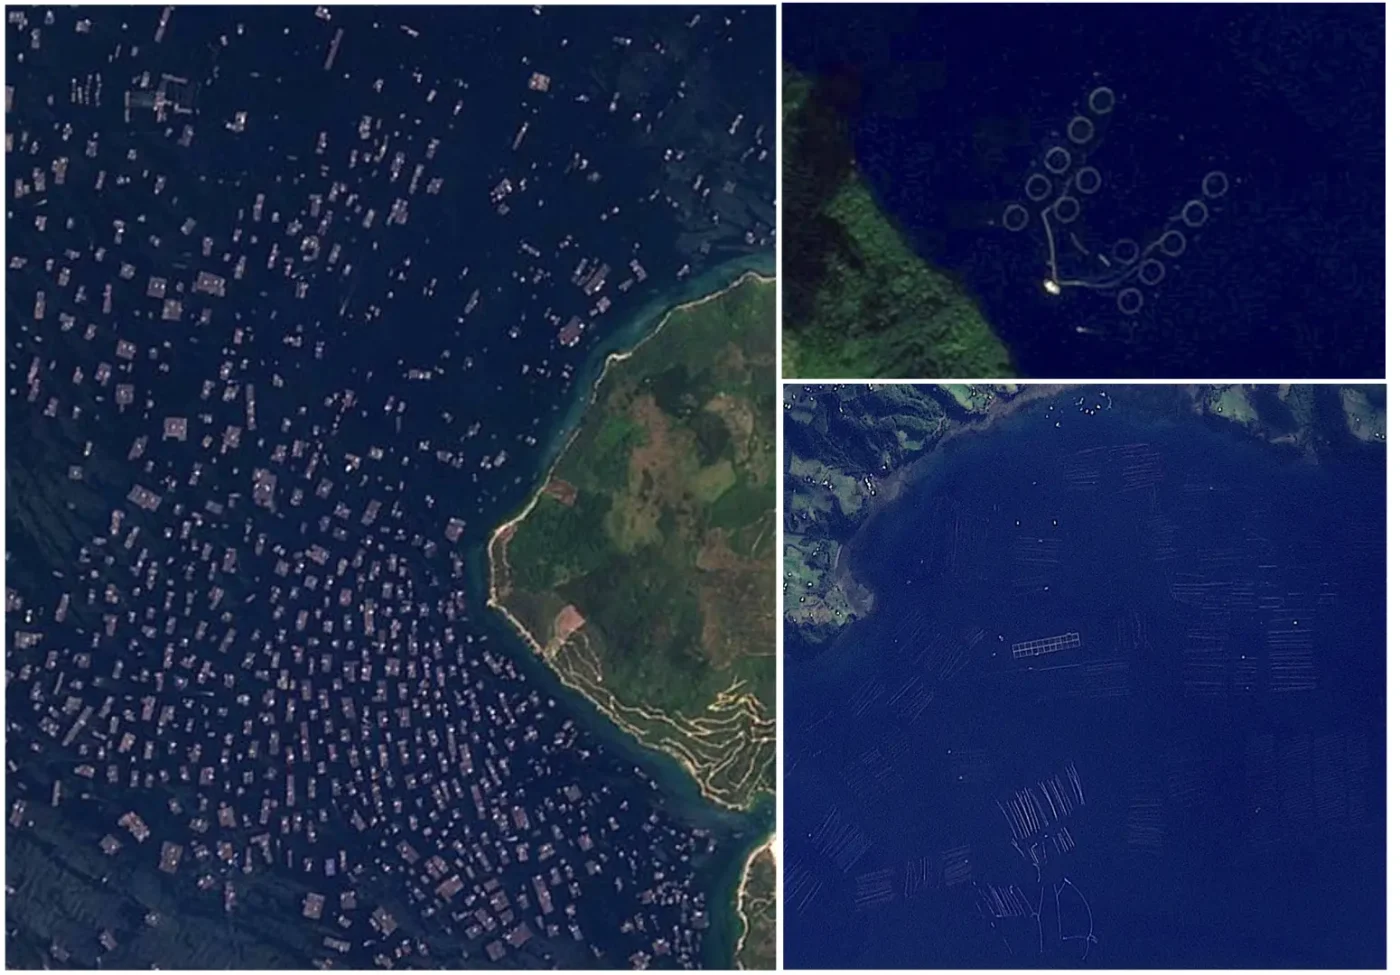
Another activity that is growing rapidly in the ocean is aquaculture. Mariculture–aquaculture in the ocean–now accounts for about 20 percent of the fish from the sea consumed by humans and is growing. It is widespread, with cages or pens clearly visible in Planet’s imagery in coastal regions including Norway, Vietnam and Chile.
It is common for vessels to meet up at sea to exchange goods and crew. However, this can also be a way to try to avoid oversight at ports and these encounters are often associated with illegal transfers of goods or crew. Using Planet’s imagery, we can now detect vessel encounters at scale across the global coastal waters.
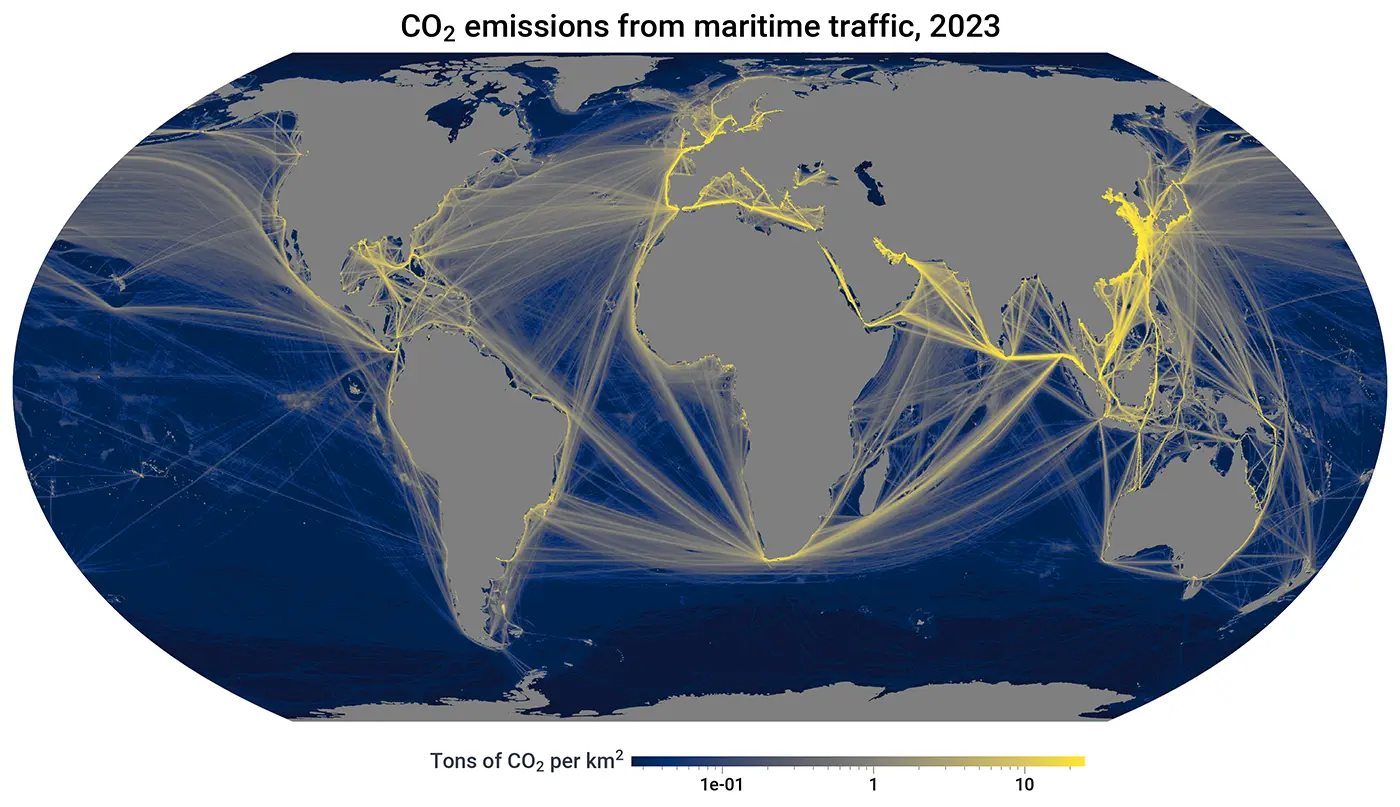
Estimating the carbon emissions of all vessels at sea
Finally, one of our goals at Global Fishing Watch has been to estimate the greenhouse gas emissions of all human activities in the ocean. However, our current estimate misses most of the vessels smaller than 12 meters. Although their emissions are small compared to the cargo and tanker vessels, they are still important, potentially accounting for maybe a third of emissions from the fisheries sector. Because we can estimate the speed of each vessel and its size using Planet’s imagery, we can also estimate the amount of fuel being used, and thus the estimated carbon emissions.
Historically, what happened on the ocean went unmonitored and undocumented, which is a major reason that as much as 20 percent of fishing activity has been illegal, unregulated or unreported. Unlike on land, where you can use public mapping services to see satellite imagery of almost every building in the world, in the ocean there are no public maps of where fishing activity, shipping, mining, aquaculture and offshore energy activities are taking place. Now, with Planet’s high resolution imagery, we are revealing these activities throughout the world’s coastal waters. This information can empower better enforcement, improved placement of marine protected areas, and a fairer, more equitable use of the oceans.