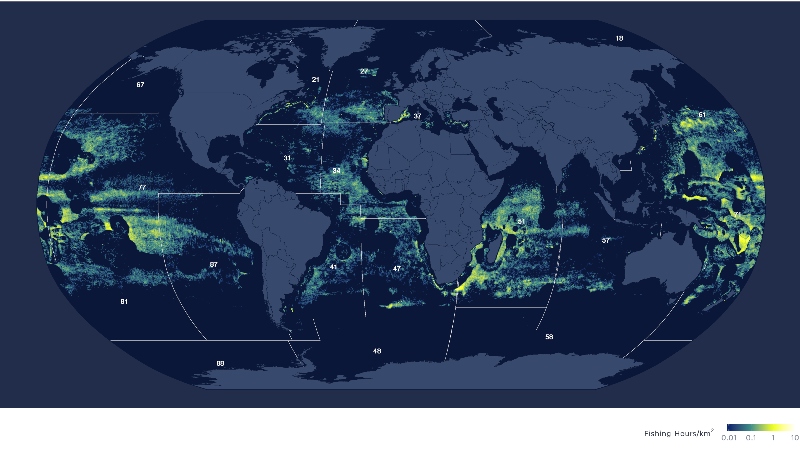
In 2018, Global Fishing Watch (GFW) published the first ever global maps of fishing activity using AIS data. These fishing maps drew on billions of GPS positions broadcast by over 60,000 fishing vessels, and they revealed fishing operations in all oceans in incredible detail.
These new methods, though, had yet to be vetted by the wider marine science community, and their applicability to fisheries management was not yet established.
Over the past two years, working with the United Nations Food and Agriculture Organization (FAO), AZTI, and the Seychelles Fishing Authorities, we have reviewed, in detail, the challenges and opportunities of this new dataset. In addition, we have received feedback from over 80 fisheries experts from around the globe. What emerges is a much more detailed, global understanding of the strengths and weaknesses of automatic identification system (AIS) for monitoring fisheries.
Our teams of researchers made two key comparisons between AIS data and other fisheries data. First, we compare the number and size of vessels observed in Global Fishing Watch with official FAO statistics on fleet sizes. Second, we compare fishing operations measured by GFW with an estimated catch in each FAO area.
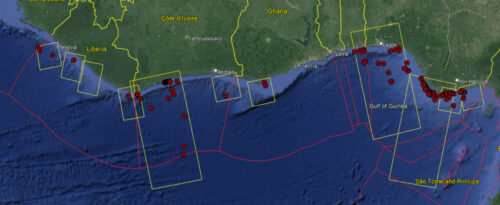
These comparisons reveal important details about the AIS dataset. AIS is best at tracking larger vessels, and for measuring fishing activity in the high seas, particularly by longline fleets. The majority of fishing vessels in the world larger than 24 meters broadcast AIS, with this fraction being higher in wealthier countries than poorer ones (for instance, almost all large vessels in Europe broadcast AIS, while very few flagged to African or South Asian ones do). Longline fleets in the high seas are also well represented in the AIS — and their large spatial footprint can be seen throughout the Atlas’ maps (see image below).
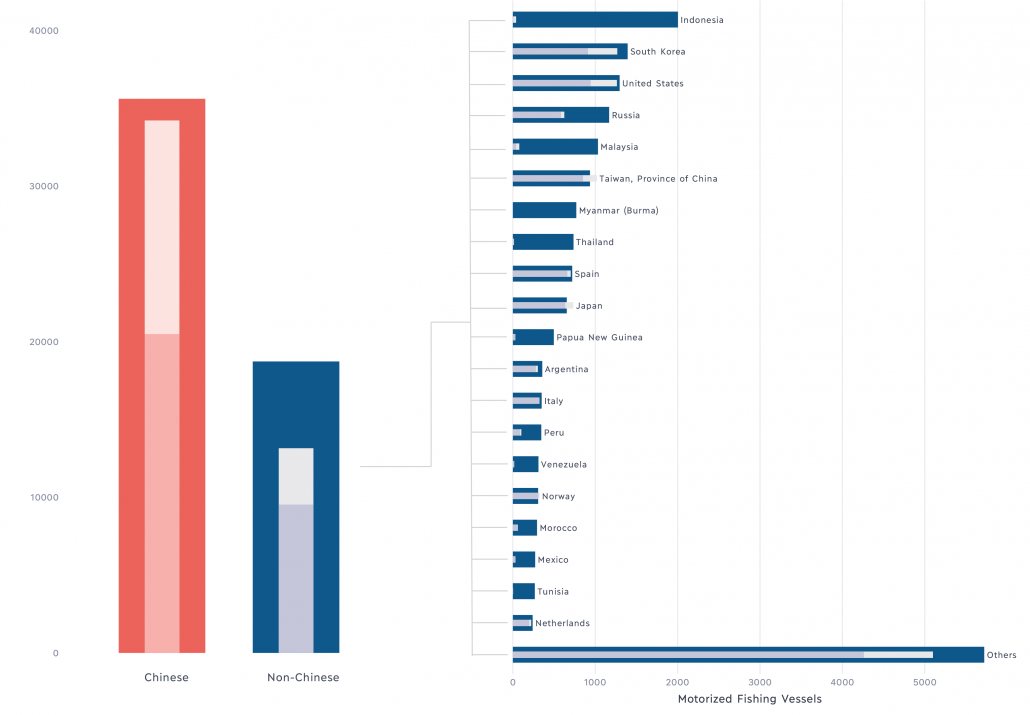
The analysis by country and territory is particularly striking. The figure below shows the number of vessels larger than 24 meters by country, according to the FAO, and the number that are broadcasting AIS. China is shown separately because almost two thirds of the vessels larger than 24 meters in the world are in China. Among the remaining countries, the fraction of vessels broadcasting varies considerably. In Indonesia, almost none of the large vessels broadcast AIS, and the story is similar in Malaysia, Myanmar, Thailand, and Papua New Guinea. In contrast, almost all European countries, and all wealthy countries, have very high adoption of AIS.
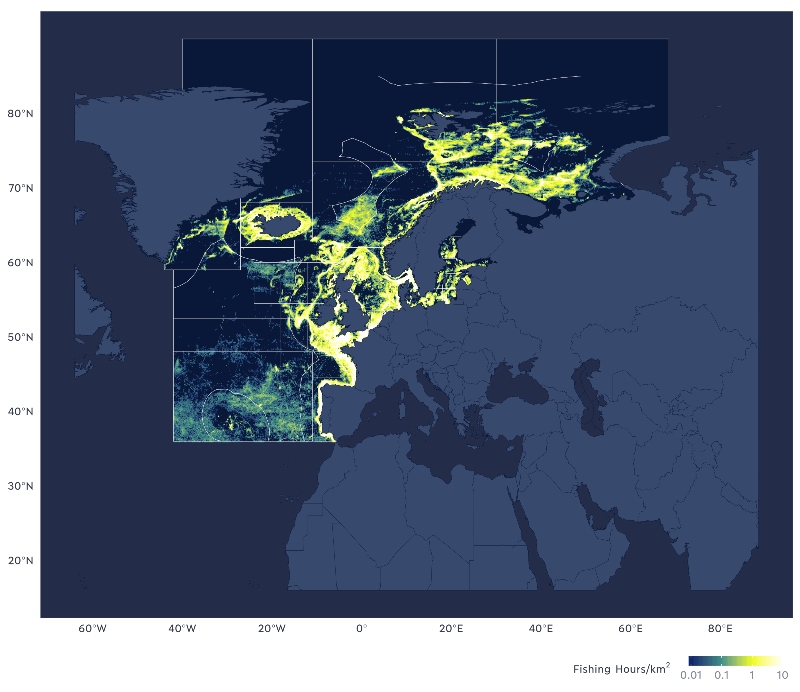
Region by region comparisons for this data reveal where AIS data provides a near-comprehensive view of fishing, and where it is lacking. In FAO Area 27, which encompasses the Atlantic coast of Europe, AIS provides almost as much fishing activity as is provided by logbooks and proprietary vessel monitoring systems. Almost all vessels larger than 15 meters broadcast their movements by AIS.
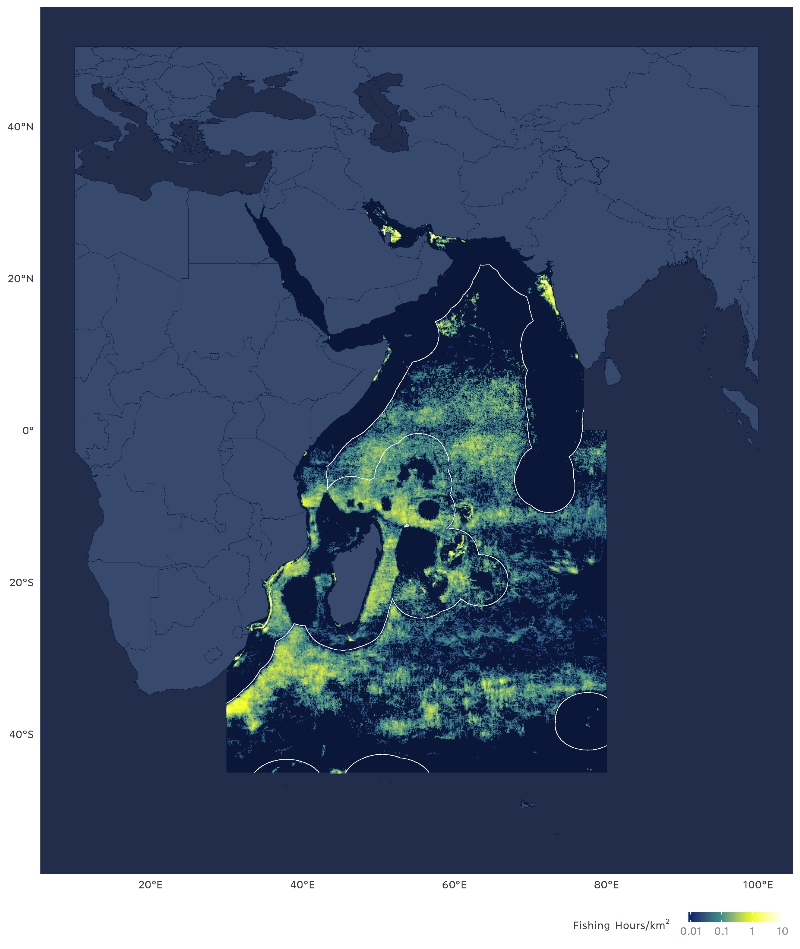
In comparison in Area 51, the western Indian Ocean, only a small fraction of the vessels use AIS, and the picture provided by AIS is incomplete. Most of the vessels broadcasting are foreign fleets operating either in the EEZs of African nations or in the high seas. Because the local fleets do not broadcast, the dataset suggests that foreign fleets dominate the region more than they actually do. Also, many pelagic purse seines, likely due to a history of piracy near Somalia, often turn off their AIS while fishing the region. As a result, AIS has limited use in the demersal fisheries of the Indian Ocean, but it can be used to estimate the fishing activity of the pelagic longline fleets operating throughout the region.
A key promise shown by the dataset is that it is available much more quickly than catch reconstructions and official VMS data. For some of the comparisons with other datasets, we had to use data that was from a few years earlier. The catch reconstruction data we compared the AIS to was for 2010 to 2015 because newer data was not available. The picture provided by AIS may not be complete, but it is much more rapid, and can allow an assessment of where the fishing activity is taking place before waiting for the official assessment. Moreover, the comparisons have revealed places where catch estimates are likely misplaced spatially or missing; squid fishing activity off South America is well mapped in the GFW data set, but poorly in some of the catch reconstructions.
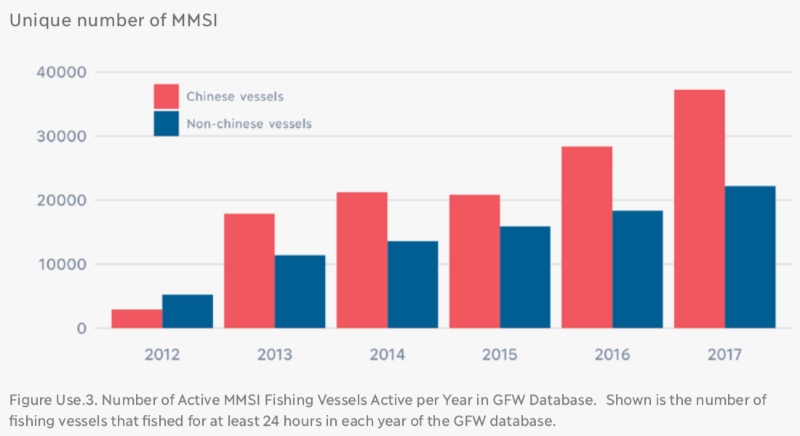
And finally, we found that AIS use is increasing; each year, 10 to 30 percent more vessels are broadcasting AIS, increasing our ability to track vessel activity in the world’s oceans. Over time, as more countries and vessels adopt the technology, its utility will continue to increase. Assessments such as this one will help managers better understand and track fishing activity in their waters.
Taconet, M., Kroodsma, D., & Fernandes, J.A. (2019). Global Atlas of AIS-based fishing activity – Challenges and opportunities. Rome, FAO.