Our research paper, “Tracking the global footprint of fisheries,” was published today in Science. A key finding of the study is that fishing is remarkably non-seasonal at a global scale. What matters far more than any natural annual cycle, it turns out, are cultural and political factors: fishers in North America and Europe don’t work on Christmas and weekends, and Chinese fishers don’t work during the summer, when a moratorium limits fishing in Chinese waters, or during the Chinese New Year.
Below is an interactive chart where you can explore how fishing changes over the course of the year. Select any two countries and see how fishing changes. The default display compares Chinese and non-Chinese vessels (see figure 2 from our paper for another representation of this graph). On this chart you can clearly see the drop in fishing during the summer months in China, and you can see the weekly pulse of fishing among non-Chinese vessels (interestingly, it looks like Chinese fishers don’t take weekends off). Note you can toggle between viewing “fishing hours” per day and “number of vessels” that are fishing on a given day.
Below the two charts are a series of bubbles, arranged somewhat geographically, representing each flag state in our data. The inside circle shows how much fishing that flag state does on a given day, and the larger circle shows the maximum amount of fishing by that flag state. If you hit play, you can see the weekly pulse of fishing in European countries. You can also click on a bubble to see the time series for that country.
You are welcome to embed this interactive on your site. Note you can also zoom out and see the entire time series of our data, from 2012 to 2016. When you do this, you see that fishing has increased for most countries. This increase is not because there is more fishing, but rather because more vessels installed Automated Identification System (AIS) devices and because our terrestrial and satellite AIS coverage increased. For instance, the EU mandated AIS on all fishing vessels larger than 15 meters in 2013. What we see in our data, though, is that many EU vessels did not immediately adopt the new technology, and it was not until 2015 or 2016 that almost all of these vessels were broadcasting AIS. Similarly, you can see that the U.S. increased its AIS requirements in the spring of 2016.
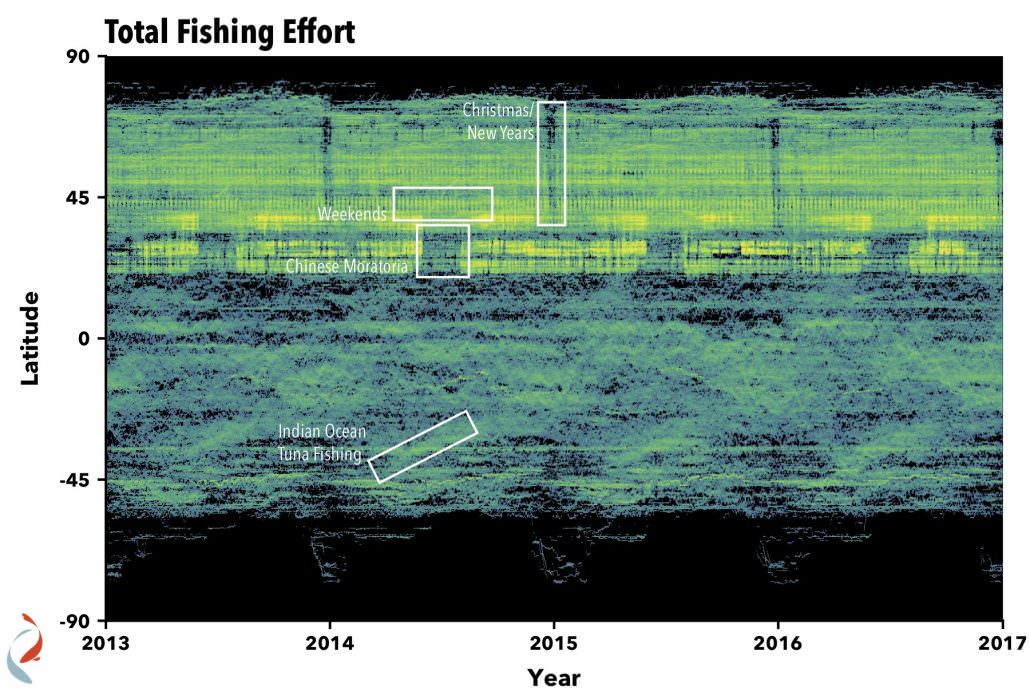
Another way to look at how fishing changes over time is in figure 2A from our paper. It shows the fishing effort by day and latitude. In this chart, the intensity at a given pixel reflects the total amount of fishing effort at all places on earth at that latitude on that day. Note that for this chart we included only vessels that were active in all four years, thus eliminating the effects of more vessels adopting AIS. This chart shows a few striking patterns. Fishing is more intense in the northern hemisphere than the southern. This is partially because countries in the northern hemisphere have stricter AIS regulations, and thus more of them show up in our database. However, it is also largely because there is much more economic activity and much more coastline in the northern hemisphere, which results in more fishing. Also, we have highlighted the Chinese moratoria, weekends (which show up as those rippled looking ridges), and the Christmas/New Years holiday in Europe and other mostly-Christian nations. There are some seasonal responses, such as the how longline fleets in the Indian ocean move with water temperature, but at a global scale, these don’t stand out as much as the cultural and political phenomena. We’ve written about the Indian Ocean tuna fishing, and showed how these vessels are following the seasons, on this blog post for Google Earth and Earth Engine’s Medium blog.