None of what we’re doing at Global Fishing Watch would be possible without the advancements in computing power that have occurred in recent years. The volume of data we work with would have been overwhelming in the past. In one random sample, we observed more than 127,000 vessels over a 24-hour period broadcasting the Automatic Identification System (AIS) signals we use to track fishing behavior. Each signal contains multiple messages (vessel location, call sign, speed, etc.), and some of the signals refreshed as often as every five seconds. That means there are billions of data points to feed into our computer systems. It takes tremendous processing power to handle all that data, and it takes an intelligent machine to make sense of it.
We’re employing two different kinds of machine learning to help us process all those AIS messages, and to teach us about commercial fishing activity based on the vessel’s movements on the water. To determine when vessels are fishing, we’re using something called feature engineering. We assign a “yes” score when vessels are actively fishing, and a “no” score when they aren’t. To figure out what types of vessels we are seeing—whether they are longliners, purse seiners, trawlers, or other—we’re using another type of machine learning called a neural network.
In both cases, we give the computer a huge amount of AIS data that we’ve already analyzed and labeled by fishing score or vessel classification depending on what we’re training it to find. We call that the training data set. The computer sifts through it, finding patterns and determining which features are relevant and which aren’t. The computer then creates an algorithm, a set of rules that can be used to evaluate other AIS data and tell us what we want to know.
In machine learning, coming up with the right type of features, the right number of features and the right amount of training data is crucial for a computer to learn what patterns are important and come up with an algorithm that fits what we’re looking for.
For example, if you ask a computer to learn how to identify human faces by giving it six photos of human faces then tell it to analyze 1,000 features from the shape and color of eyes to nose length, skin texture, and more, it may develop a set of rules that are too specific to those six faces. The next time it sees a stack of photos, it may only recognize faces that are extremely similar to those six. In this case, the computer has overfit the model to our data. On the other hand, if we give the computer too few features to look for, or too many pictures of different people, it may underfit, identifying dogs and snowmen as humans.
Feature Engineering to Determine Fishing:
Our first step in developing a tool to determine if a vessel is fishing or not was to create a labeled data set. Our partners at Dalhousie University evaluated nearly five years-worth of fishing vessel tracks consisting of more than two million AIS messages. They labeled sections of each vessel track as actively fishing or non-fishing.
We fed half of that data (our training data set) into a computer and asked it to analyze three features–vessel location, speed and heading–and to identify patterns associated with fishing or non-fishing activity. One data point alone doesn’t tell us much, so we told it to look at strings of data points over different time windows; 30 minutes, 1 hour, 3 hours, 6 hours, 12 hours and 24 hours. Over each time window we can see a vessel’s average speed, changes in velocity (is it slowing down or speeding up?) and changes in heading (is it squirreling around or motoring straight ahead?). All combined, that’s 18 features the computer looks at all at once (average speed, changes in velocity and changes in heading over 6 different time periods).
Once the computer identifies patterns among those features it trains a model, a set of rules that it can use again and again to accurately predict when a series of data points represents fishing or non-fishing activity. To test how well the algorithm works, we input the other half of our data without the labels and ask it to identify vessel tracks and fishing versus non fishing activity.
Neural Networking, also known as Deep Learning, for Vessel Classification
In feature engineering, we determined the features we wanted the computer to analyze: average speed over different time periods, changes in velocity over different time periods, etc.
For the vessel classifier, which uses the neural network, we don’t specify the features; the computer finds them. What we do is tell it how many filters to use when sifting through the data. The computer then applies that number of filters and finds the best features to analyze for the job we want it to do.
For the sake of example, let’s say we tell the computer to look at one hour increments and apply three filters. The computer decides what three filters are most important to look at first. We will have no idea what those filters are, but let’s imagine they have to do with speed. Perhaps the first filter gets rid of everything in the data set except for fast boats (fast being whatever speed range the computer determines), the second filter looks at the data and filters out everything but boats going a medium speed, and the third does the same for slow boats.
Each filter produces its own output, so we end up with a stack of three new data sets (all subsets of the original). That’s level one. Now, that’s not very sophisticated, so we ask it to go another level deep, and apply a new set of filters to each of the three data sets that resulted from level one. For level two, let’s say we tell it to apply six filters. Maybe the computer decides to go with the consistency of the boat’s speed: Is it consistently going fast (cruising), consistently slow (drifting), occasionally changing speed, regularly changing speed, and whatever other iterations of that questions it comes up with. The computer will apply all six filters to each of the three layers it created in level one. Now, we have a second stack of data sets consisting of 18 layers (6 x 3). Once again, we can go another level deep and ask for more filters.
The process can go on as long as we want. The number of levels deep and the number of filters at each level is called the topology, and it’s usually much more complicated than described here.
For example, one iteration we’ve worked with uses 9 layers with 16 filters in each for a total of 144 filters. An even more complicated model we’ve looked at uses 12 twelve layers. It begins with 16 filters and increases the number of filters in each layer for a total of 1008 filters. Using that many filters means our our analysts have to tweak the system along the way to keep the model from overfitting and taking too long. The whole business gets pretty technical pretty quickly, but after the computer has finished applying all those filters, it uses the features those filters have extracted to come up with the model output.
Just as in the vessel scoring system, we feed one half of the data into the computer for learning and hold back the other half for testing the model it comes up with. The art to deep learning is determining the number of filters we ask the computer to use and what timeframe to evaluate.
The Merger
The next step is to feed the output of our vessel classification model into the vessel scoring model, because you can do a lot better job determining if a boat is fishing or not if you know what kind of boat it is.
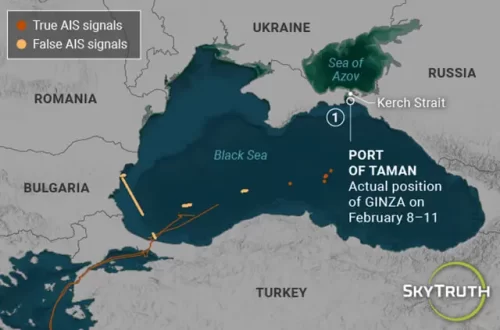
One of the biggest challenges we have in applying all this technology to fishing data is that the data is really terrible. For instance the density of AIS signals is all over the place. You can think of it in comparison to teaching a computer to recognize a song on the radio. (Think Shazam.) Music consists of a pretty constant set of data points, say 120 beats per second. Our data points are nowhere near consistent. Depending on how many satellites are overhead at one time, we may have a signal every two seconds, or we may not have a signal for hours. Depending on how many vessels are in an area, we may have tons of AIS signals that our algorithm has to parse out to find individual tracks.
Our analysts overcome that challenge in part by looking at long enough time periods to allow the data to average out. Again, it comes down to getting the mix of filters and layers right. It’s an iterative process involving trial and error, expertise and intuition. The computers are the processing powerhouses here, but humans still have to be the masterminds.
(You can read about some of the other complicating factors in our post on challenges of working with AIS data.)