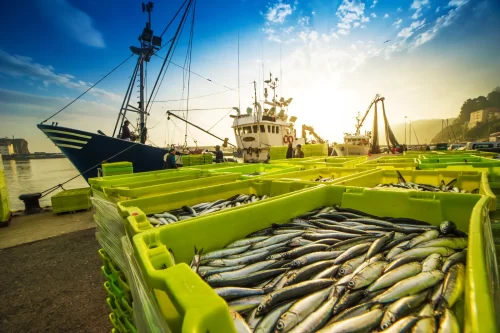
The recent publication of Global Fishing Watch’s paper, Tracking the global footprint of fishing, in the journal, Science, has attracted considerable media attention and commentary. Two common headlines used in media reports are that “over half the ocean is fished” and that the spatial extent of fishing is “four times that of agriculture.” In responses to these reports, some individuals have argued that our calculation is misleading or is not a fair comparison with the area in agriculture. In this post, we’ll share how we did the area estimate for our paper, and why we think it is justified and, in fact, relatively conservative. We have also posted the code that we used to do this calculation here.
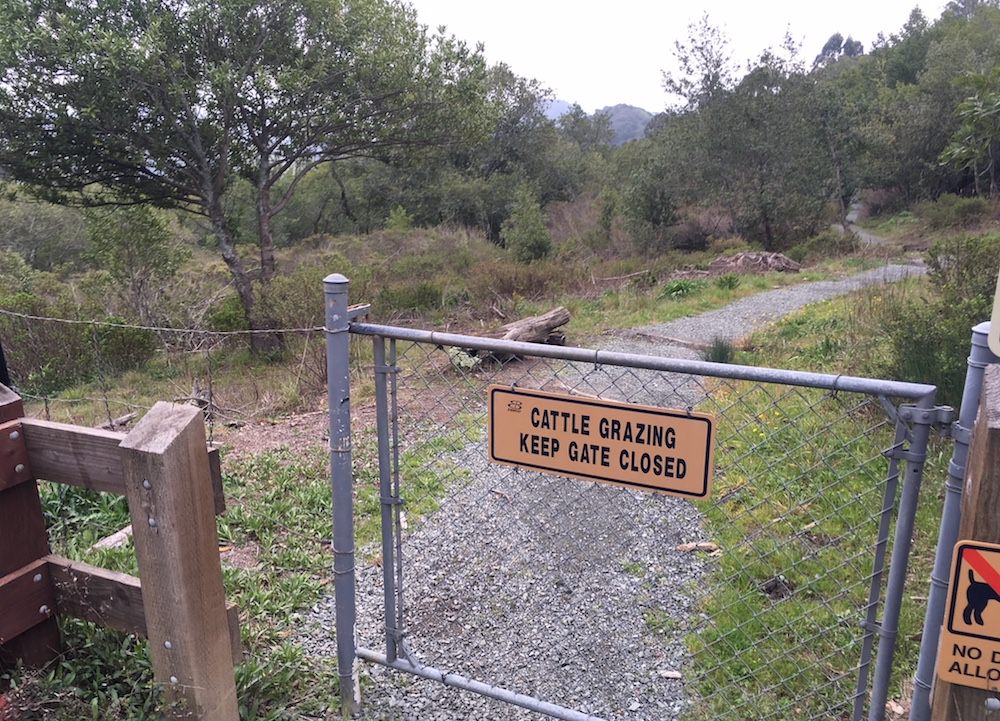
First, it’s worth considering what we mean by “area in agriculture.” About one third of the land in agriculture is intensely cultivated land, such as row crops or orchards. The rest – the vast majority – is grazing land. This grazing land, for example, includes most of the hills behind my home in California – coastal hills stretch the length of the state. I often ride my bike on small roads through these hills or go for hikes on trails, and I rarely see cattle, even though they graze there. To the untrained eye, much of the land looks like a natural ecosystem, and there is, in fact, a thriving ecosystem there, even if it is highly altered from the natural state.
Accounting for an entire ecosystem
When we measure the land used for grazing, we include the entire extent of the ecosystem that is grazed. We don’t just measure the roads that humans use to transport cattle and other livestock. By this logic, if we are to compare with the ocean, we should compare the extent of the ecosystem that is grazed and produces food in a meaningful way, and not just the narrow area covered by vessels as they cross the ocean. Unfortunately for our calculation, there are no fences in the ocean. The area estimate is also made difficult by the fact that the fish we eat are generally higher trophic levels than cattle. That is, we are eating much farther up the food chain, which expands the possible area of the underlying ecosystem.
Going by the grid
For our estimate, we divided the oceans into a grid, with grid cells about 30 miles on a side, and then counted how many of those grid cells we observed fishing activity. If we observed any fishing activity at all, we counted the cell as fished. As you can imagine, the “area fished” is sensitive to the size of a grid that you choose, and we note this in the supplemental materials of the paper. If you use a grid one mile on a side, you will get a smaller fraction of the ocean being fished. At the other extreme, if you divided the ocean into a single grid cell, you’d say it was 100 percent fished!
We choose our grid size largely to compare this area estimate with previous datasets, which were also gridded at about 30 miles on a side. Also, the 30 mile grid size seems relatively conservative, which is a general goal of scientific estimates. Drifting longlines, which roam most of the ocean, often set lines of hooks that are more than 60 miles long. One of our reviewers argued that we should be using a larger grid, as the fish caught be these drifting longlines are migratory species such as tuna and billfish that travel hundreds or thousands of miles. Conceptually, 30 miles seems somewhat reasonable, as a distance a fish might travel for food in not-too-long of a time period.
None of this calculation says anything about the intensity of environmental impact. Fishing has a very large spatial footprint, but it almost certainly has a much smaller environmental footprint than agriculture, which is responsible for massive land conversion and a significant portion of humanity’s greenhouse gases. Here is the part of the paper that describes the area calculation:
Dividing the ocean into an equal-area grid with 0.5° resolution at the equator, we observed fishing in 55% of cells in 2016. The total area fished is likely higher, as we did not observe some fishing effort in regions of poor satellite cover- age or in EEZs with a low percentage of vessels using AIS (figs. S6 and S7 and table S6). If we generously assume that these regions are fully fished, we would calculate that 73% of the ocean was fished in 2016. There may also be some regions of the high seas with good satellite cover- age where we are missing effort due to vessels not having AIS. However, given that AIS captures the majority of fishing effort in the high seas (fig. S4), this missing effort is unlikely to substantially affect our estimate. Previous work, based on ocean basin–scale landing data, estimated that >95% of the ocean may be fished when using a similar grid size (15). Though our estimate is lower, the percent- age of the ocean fished is still much higher than the fraction of land used in agriculture or grazing (~34%) (17), covering more than 200 million km2, compared with 50 million km2 for agriculture. This large spatial footprint varies by gear type and fleet. Longline fishing was the most widespread activity and was detected in 45% of the ocean (Fig. 1B), followed by purse seining (17%) (Fig. 1C) and trawling (9.4%) (Fig. 1D).
One of our key findings here is that fishing covers much less of the ocean than previously estimated. The previous global datasets (such as provided by Sea Around Us), which are based on basin-scale landing data, spread out catch across large swaths of the ocean. These datasets, while highly valuable, lack the fine-grained resolution of where vessels are moving, so they could not localize the fishing like we have in this study. In other words, the major discovery here is that large parts of the ocean are likely not fished, and that the area is actually less than previously thought.
And from page 15 of the supplemental materials:
To estimate the area of the ocean fished, we used an equal area grid with a size of 0.5 degrees at the equator. While different fishing gears may impact marine ecosystems at different scales (e.g. trawlers impact the marine environment on a more localized scale than longliners) (19,45) we map impacts on a 0.5 degree grid to allow for most direct comparisons with previous estimates of global fishing effort (14,15). If we use a 0.25 grid at the equator instead of 0.5, the area fished by vessels with AIS drops from 55% of the ocean to 49%.
To account for areas of the ocean where vessels might not have AIS, we analyzed all the EEZs where the associated flag state had less than 50% of its vessels larger than 24 meters based on our survey of vessels with AIS (table S4, fig. S6) (see section 5.3). We also included all areas of the ocean where we had less than 20 positions per day per vessel for class A devices (fig. S6D), as our fishing algorithms deteriorated below this level (fig. S7). For every pixel in these regions where we did not see fishing activity, it is possible that fishing did indeed occur, and this unfished area in low-coverage areas equaled ~18% of the ocean. This likely significantly over counts the potential area in fishing, as it is unlikely that every bit of these exclusive economic zones is fished.
Another reason we do not believe that these areas are fished is that we see fishing vessels transiting through many regions of the ocean without engaging in fishing. About 15 percent of the ocean, at our same 0.5 degree grid, has fishing vessels transiting through the region, but no fishing activity. For instance, vessels cross the Souther Atlantic between Argentina and South Africa, or transit across the northeast Pacific between Alaska and Seattle, but never exhibit fishing behavior (fig. S6A,B).
For the comparison with land area, global land cover surveys estimate that 38% of the ice-free land is covered in ice (17). Adjusting for the area of land covered by ice (10%) (46) gives 34% of the total land.
We’ve posted the code for doing our calculation here. We created a raster 0.5 degrees, then reprojected it to an equal area grid. We changed every grid cell to 0 or 1 (fishing or no fishing), and then clipped this raster by the coastlines and calculated the average value across the ocean area. By clipping the raster along the coastlines, we effectively are giving the grid cells along the coastlines a higher resolution, which partially addresses the concern of not using a small enough grid for coastal trawling.
Ultimately, while this comparison between agriculture and fishing is imperfect, we believe this calculation is a reasonable way to compare the spatial extent of the two activities on the earth’s surface, and our estimate likely undercounts the area “fished,” largely because fish move farther than 30 miles, and because we don’t see all the fishing vessels in our dataset.